

This update reviews XRP’s current market structure and pattern development using hand-built monowave charts and orthodox NEoWave logic.
6-Monthly Chart
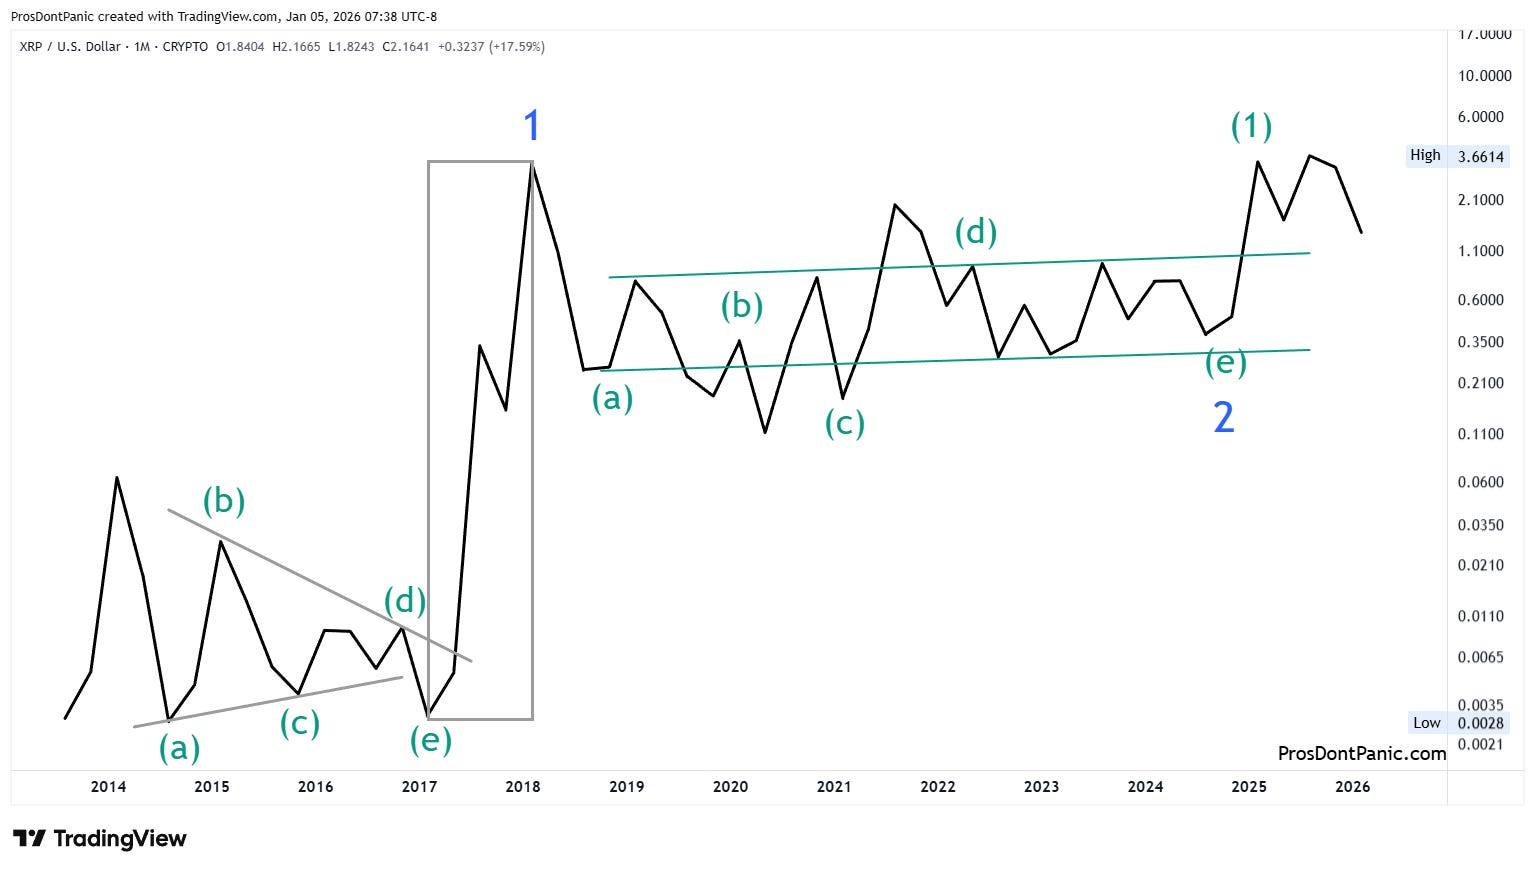
XRP launched an impressive impulse pattern that completed at the end of 2018 followed by a Contracting Triangle correction that confirmed complete in 2025.
Blue (higher degree):
Have marked Wave-2 complete in 2025. Looking for a decisive break of Wave-1’s high to confirm Wave-3 has truly commenced.
Blue trend= UP
Green (lower degree):
Tracking what appears to be wave-(2) of 3 on the lower charts below. Wave-(2) is at midpoint and clarity is low.
Green trend= UP
Monthly Chart
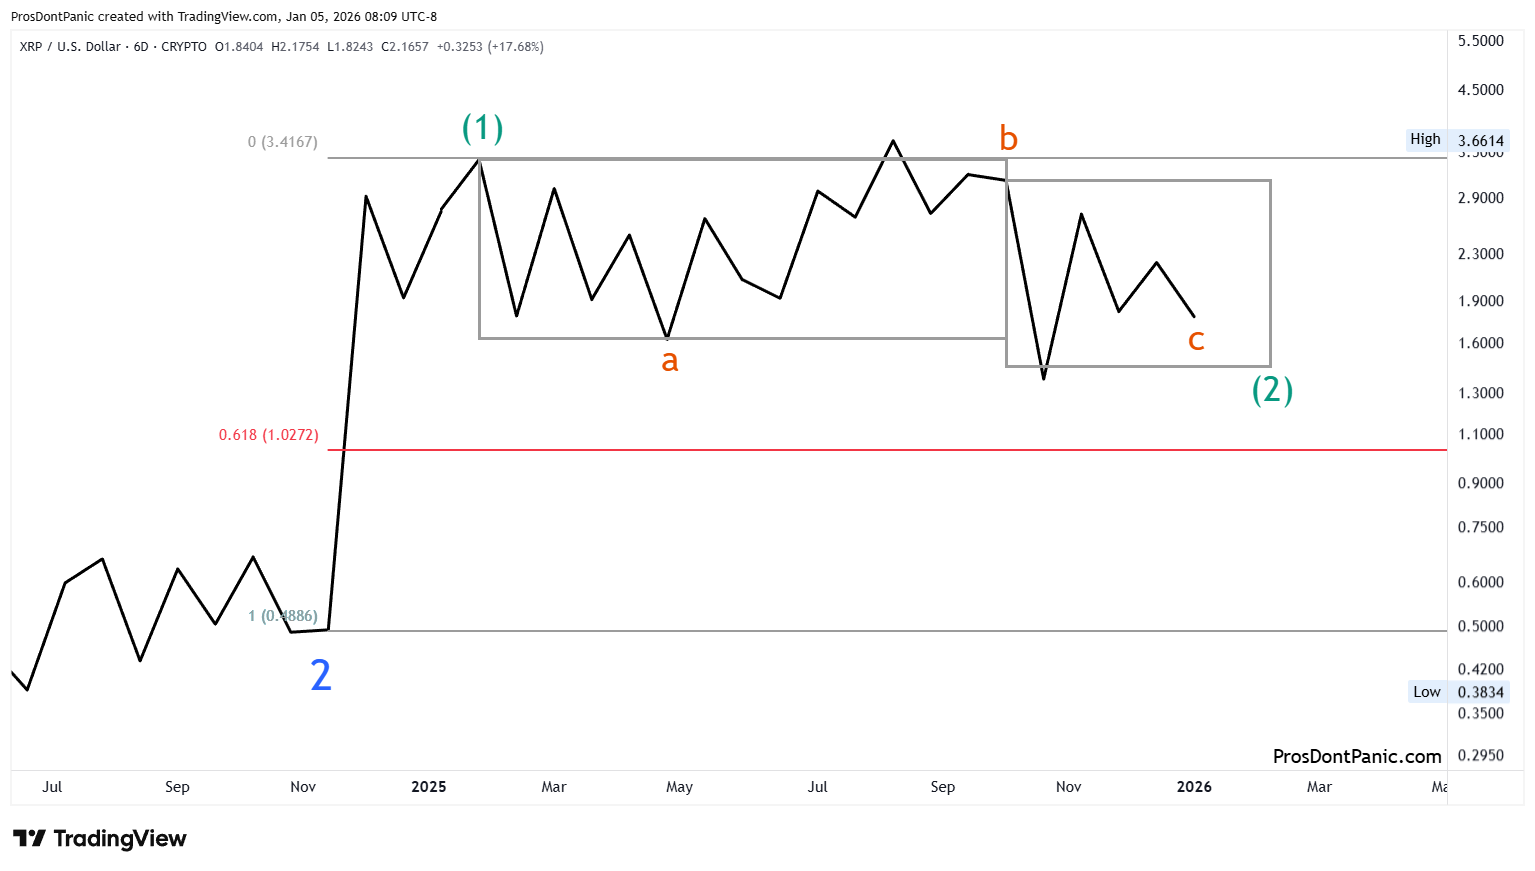
Tracking Wave-c of (2):
The complexity of waves-a and b require that wave-c subdivide a bit more so we are looking for that.
The time boxes give the minimum expectation of the time that wave-c will consume.
Weekly Chart
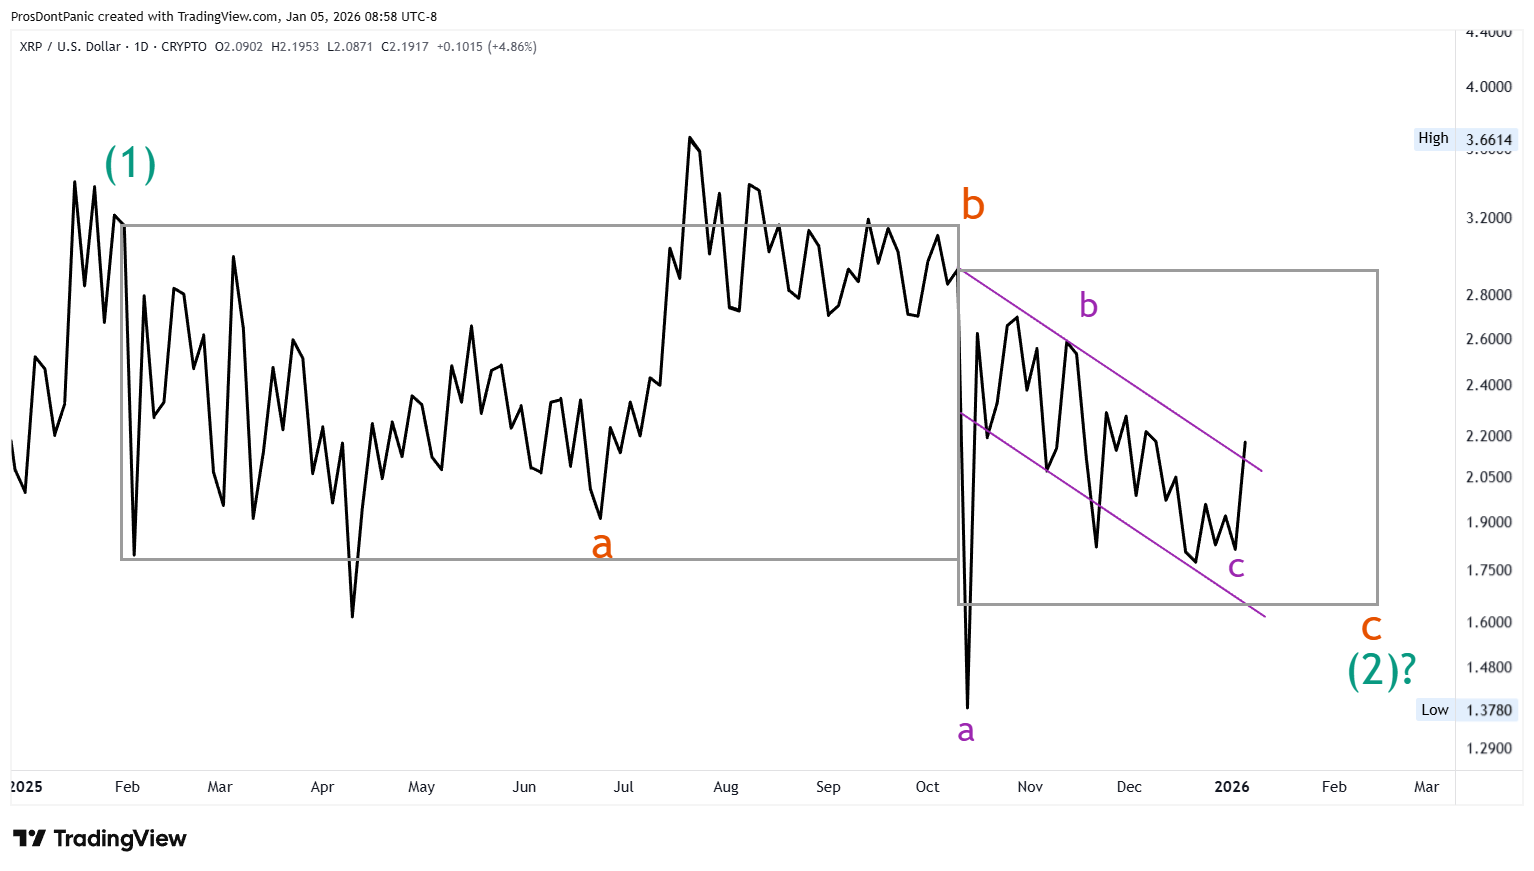
Tracking Wave-c of (2):
Wave-(2) may be subdividing into a 5-wave triangle so we are watching for this after wave-c completes.
Be cautious here as there could easily be purple wave-d and e subdivisions before we can call orange wave-c complete.
Bottom Line
The charts above are showing that Wave-3 has started. XRP’s actions must reflect this or we will be forced to conclude that the sharp rise is only wave-(d) of a developing Wave-2. The Weekly Update will keep tracking this.
This content is provided for informational and educational purposes only and does not constitute trading, investment, or financial advice. PDP does not provide trade recommendations, entry or exit signals, or portfolio guidance.