

This Weekly Update reveals DXY’s latest market structure and pattern development using custom monowave charts and orthodox NEoWave logic. I track patterns in the stock and crypto charts so you can make informed decisions about future market direction.
https://prosdontpanic.com
2.5 Yearly Chart Chart
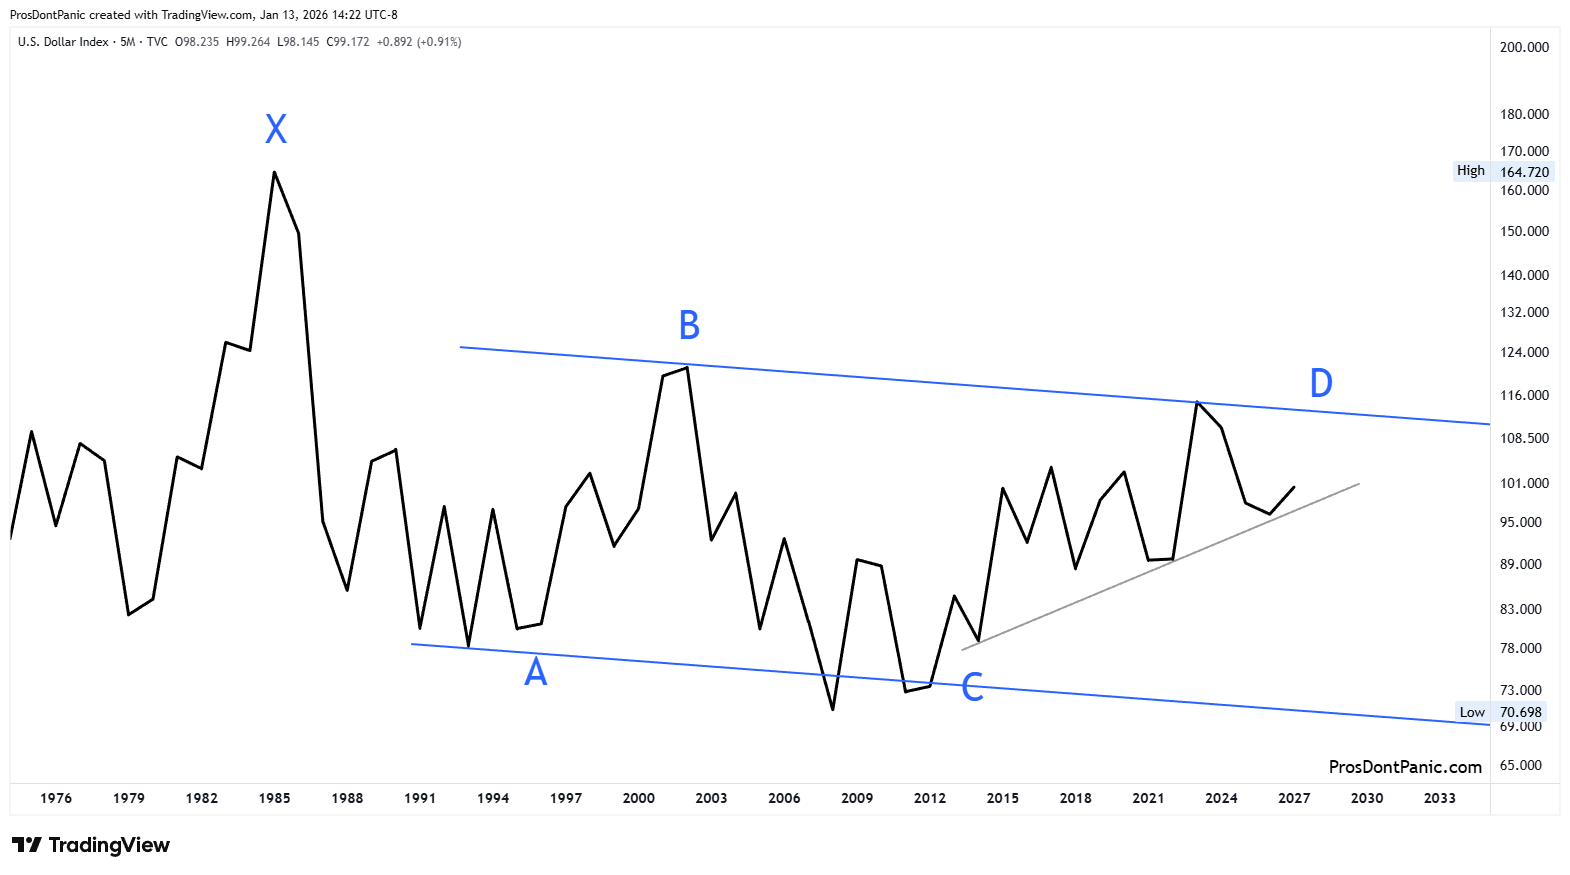
The Dollar Index has been in an overlapping Contracting Triangle pattern since the peak in 1985.
Major trend (Blue waves A, C, E) = DOWN
6-Monthly Chart

Focusing on Wave-D:
Wave-D is an obvious overlapping correction and not the start of a new upward trend.
The move down off the termination of Wave-D is enough to call it confirmed complete but the entire wave-D may subdivide into a 5-wave triangle. We need a bit more time to clarify the course and see if Wave-E has truly kicked off yet.
Bottom Line
DXY has been in an overlapping Contracting Triangle correction since 1985. A decisive break of the lower trendline of Wave-D may be enough to call it complete and kick of wave-E. That hasn’t occurred yet so we wait.