

This Weekly Update reveals DXY’s latest market structure and pattern development using custom monowave charts and orthodox NEoWave logic. I track patterns in the stock and crypto charts like an air traffic controller so you can make informed decisions about future market direction.
https://prosdontpanic.com
2.5 Yearly Chart Chart
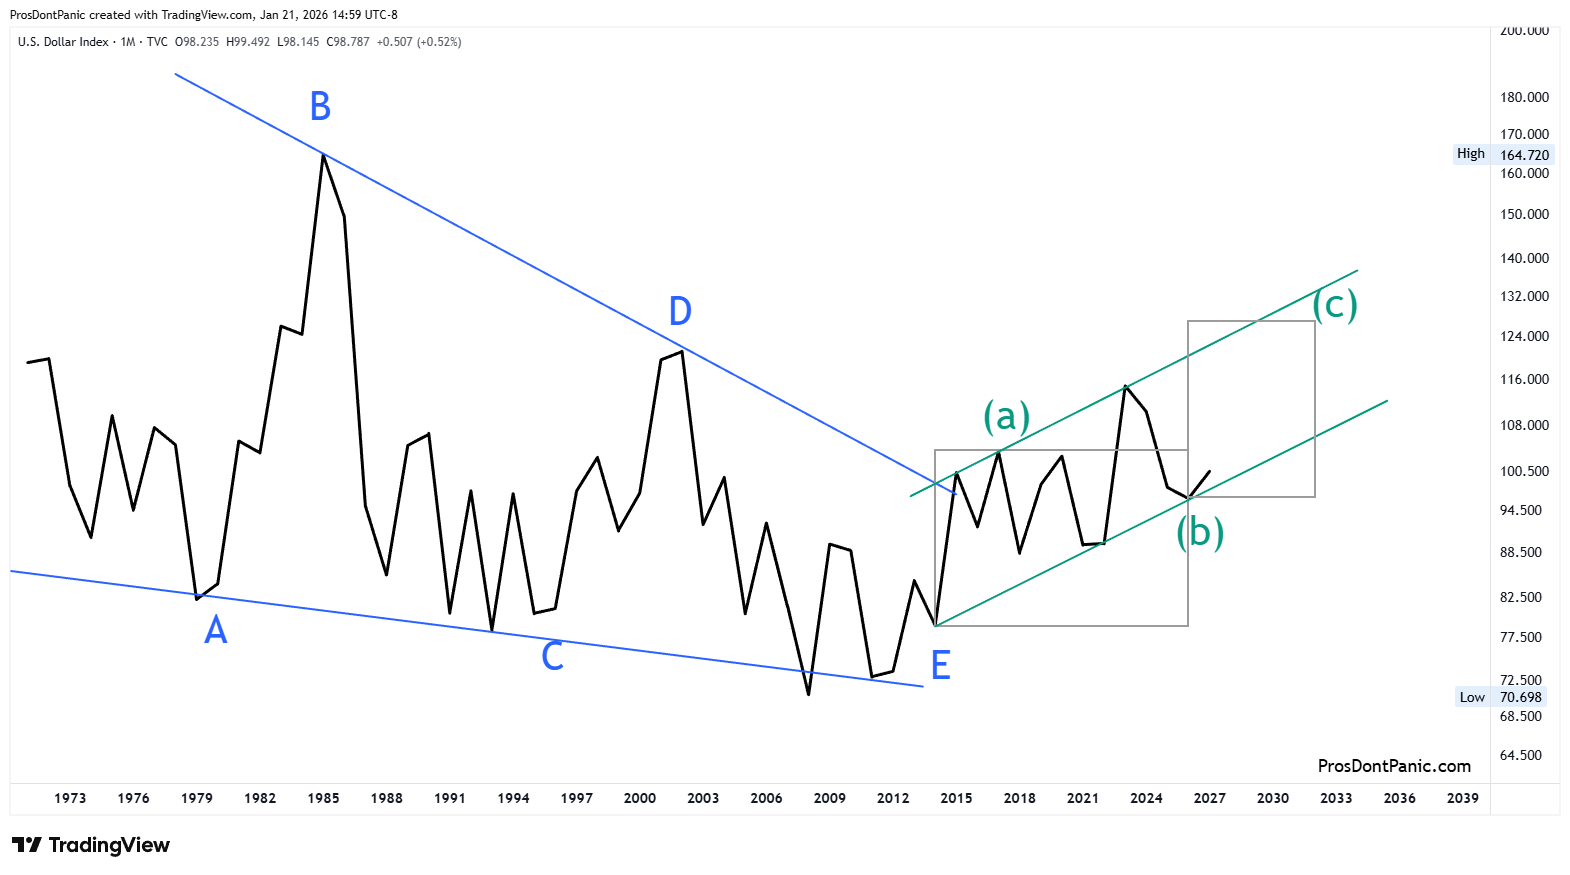
It appears that DXY completed a triangle pattern in 2014 but the expected trend change and thrust following a triangle has slow-going and this is a violation of NEoWave logic. So what is happening with DXY is unclear at this stage.
Here is what we know:
Wave-C and E are faster and stronger than B or D so the major trend is DOWN
It is possible that the entire downside triangle is still bottoming.
6-Monthly Chart
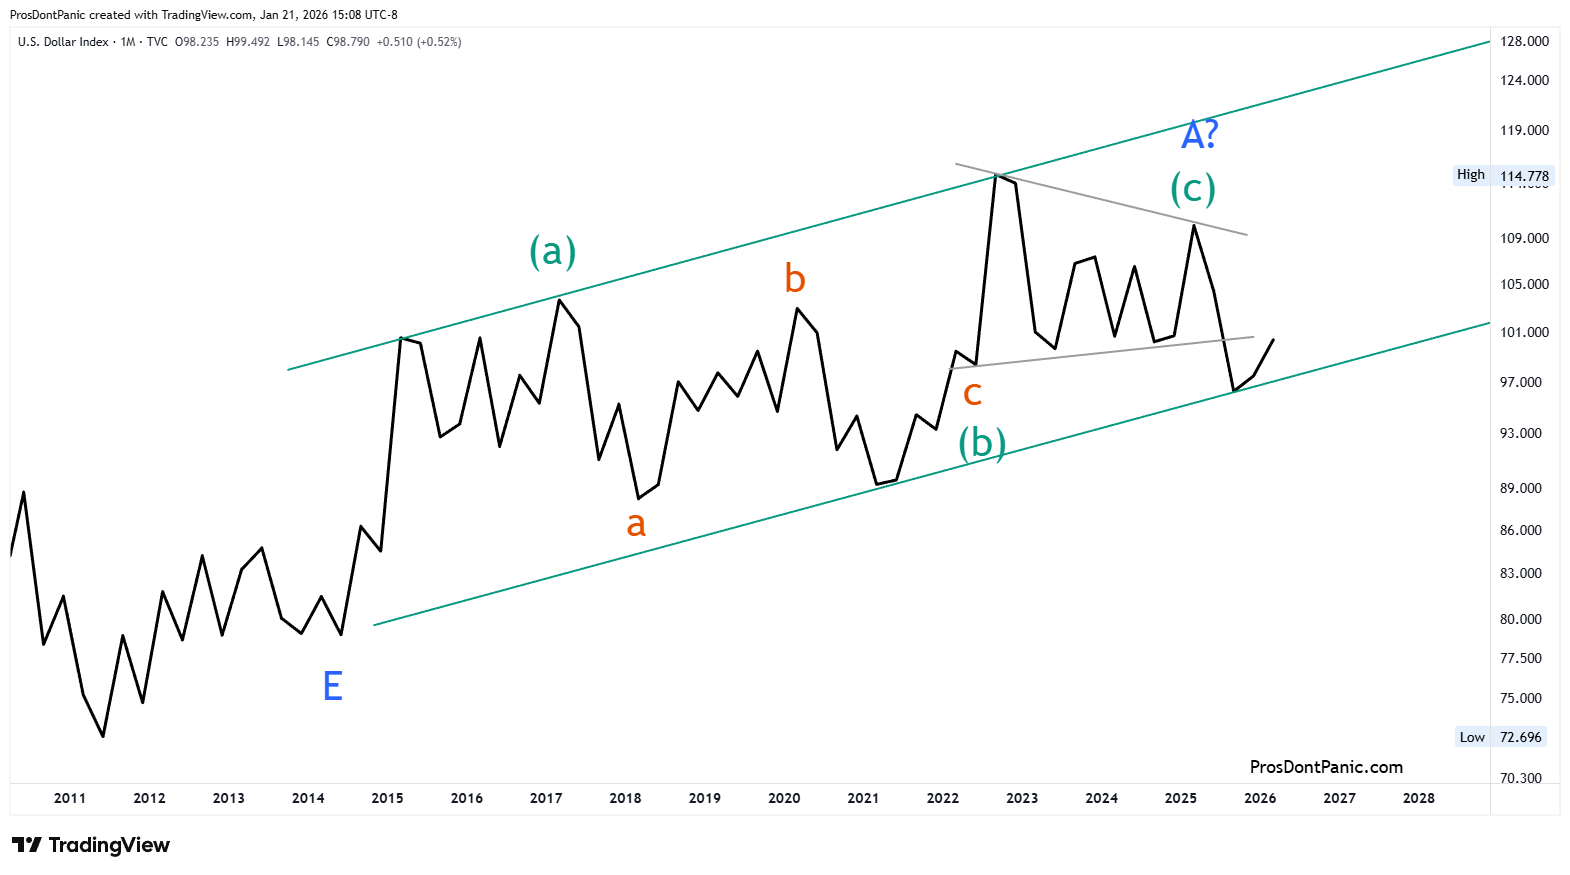
Bottom Line
DXY appears to have completed a triangle correction in 2014 but the expected upside thrust following a triangle been slow. This means the downside triangle may still be bottoming. There is no clear direction at this point so we will track what we can and wait for clarity.
- - -
This content is provided for informational and educational purposes only and does not constitute trading, investment, or financial advice. PDP does not provide trade recommendations, entry or exit signals, or portfolio guidance.