

This update reviews Solana’s current market structure and pattern development using hand-built monowave charts and orthodox NEoWave logic.
6-Monthly Chart
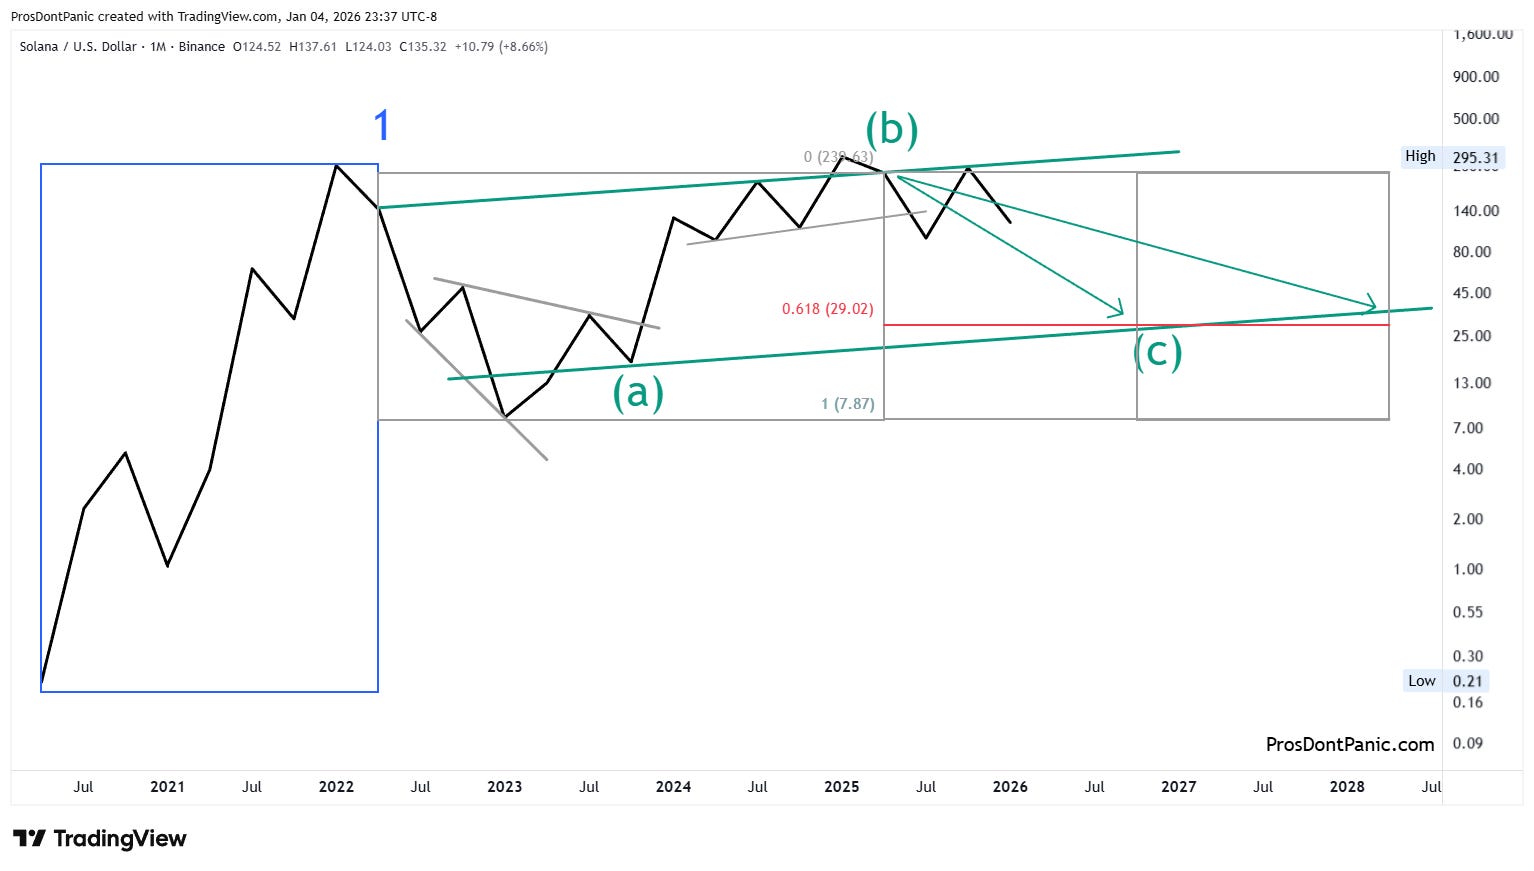
Solana traced out a perfect 5-wave impulse pattern that completed at the end of 2021 followed by a correction that is still evolving. It doesn’t get much more textbook than this.
Blue (higher degree):
Wave-1 complete in 2021, Wave-2 in progress.
Blue trend= UP
Green (lower degree):
I have marked wave-(b) as complete. Wave-(b) exceeded the start of wave-(a) which makes this a running correction.
The price/time boxes are only a suggestion in a running correction as the market can drift much higher.
Green trend= DOWN
Monthly Chart
Tracking Wave-(c):
Wave-(c) will be a choppy, overlapping market through 2028. The time boxes give an expectation of the time that wave-(c) will consume.
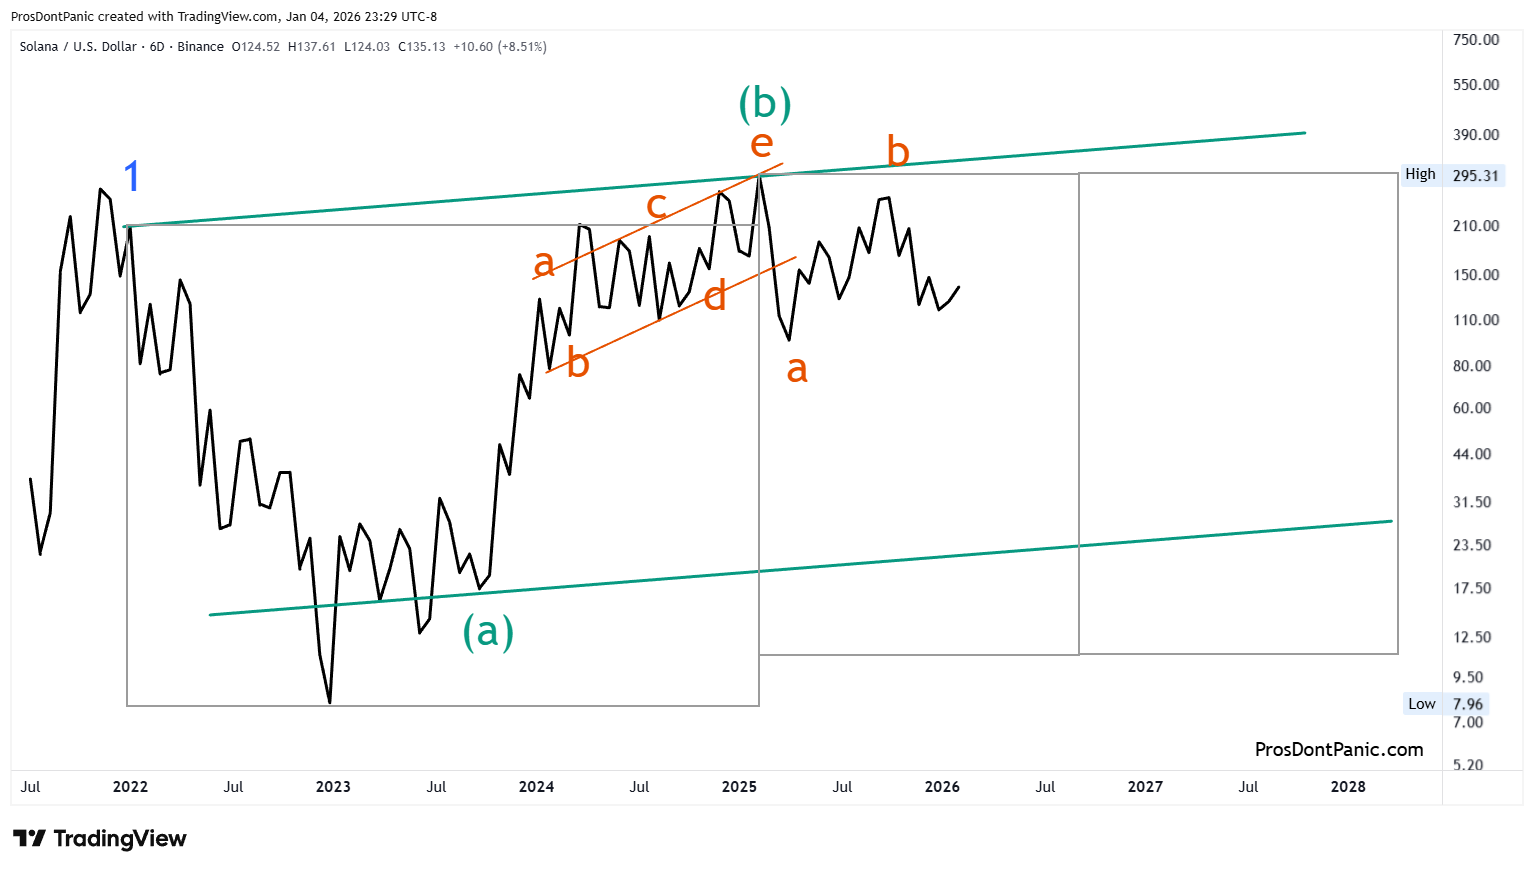
Weekly Chart
Tracking Wave-c of (c):
Clarity at this point in wave-c is low. I have traced out a 5-wave impulse pattern to show the directional changes. Impulse waves should not be sitting in a parallel channel so this count will probably need to be adjusted as the wave progresses.
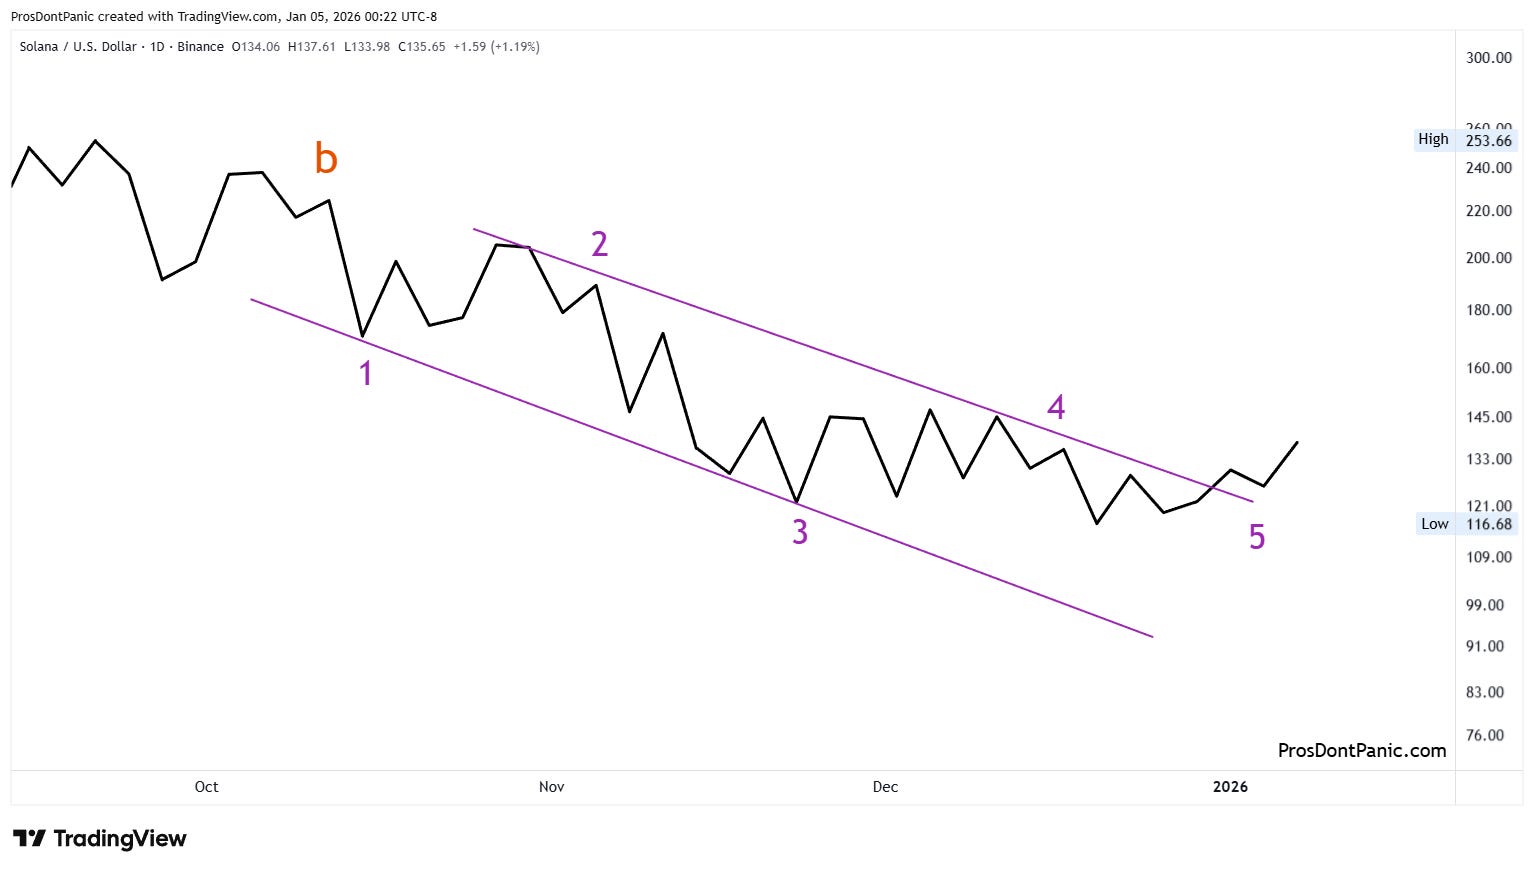
Bottom Line
Solana is in Wave-2 with Wave-c of (c) of 2 unfolding. Wave-2 is a running correction which means waves (b) and (d) of wave-2 can pull the market higher.
This content is provided for informational and educational purposes only and does not constitute trading, investment, or financial advice. PDP does not provide trade recommendations, entry or exit signals, or portfolio guidance.