

This update reviews the S&P 500’s current market structure and pattern development using orthodox NEoWave logic and analysis.
SPX is completing a 26-year running bear market correction which everyone thought was the “bull market”. We need to get through the end of Wave-(4) which is completing wave-E then the real bull market will begin.
2.5 Yearly Chart
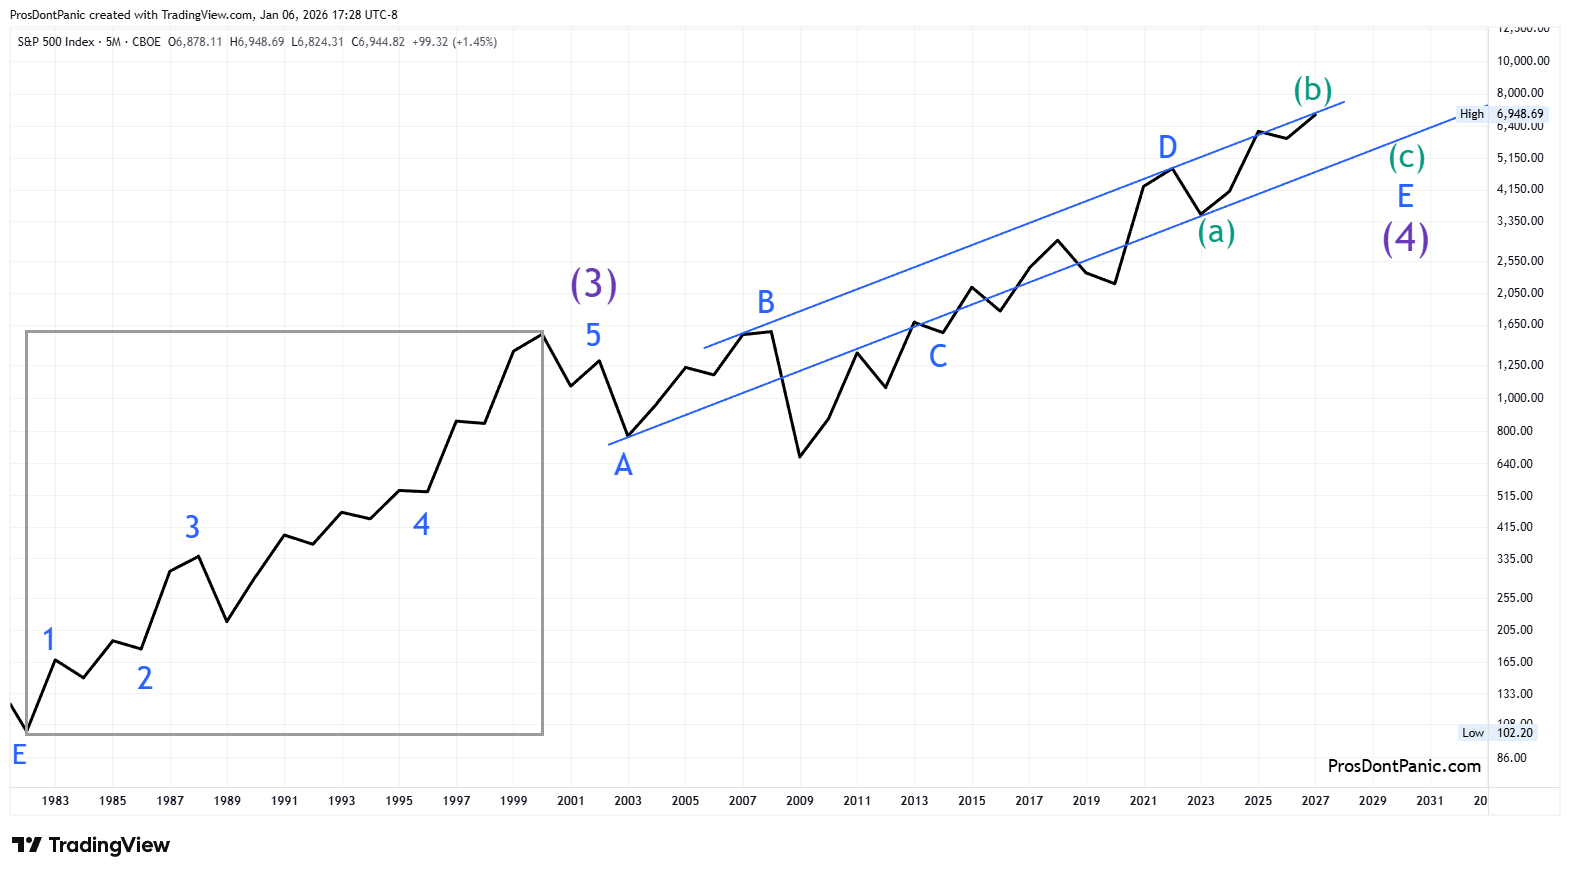
Purple (higher degree):
Impulse wave topped in 2000 and commenced a 26-year running correction marked here as wave-(4).
Purple trend (Wave 3)= UP
Blue (lower degree):
Wave-E of (4) has been tracing out an ABC pattern in opposition to the larger trend.
Blue trend= DOWN
6-Monthly Chart

A closer look at Wave-(4) shows that wave-E is finishing up a Neutral Triangle. When its finished Wave-(5) should commence with all degrees going to the upside and a very powerful upside potential.
Weekly Chart
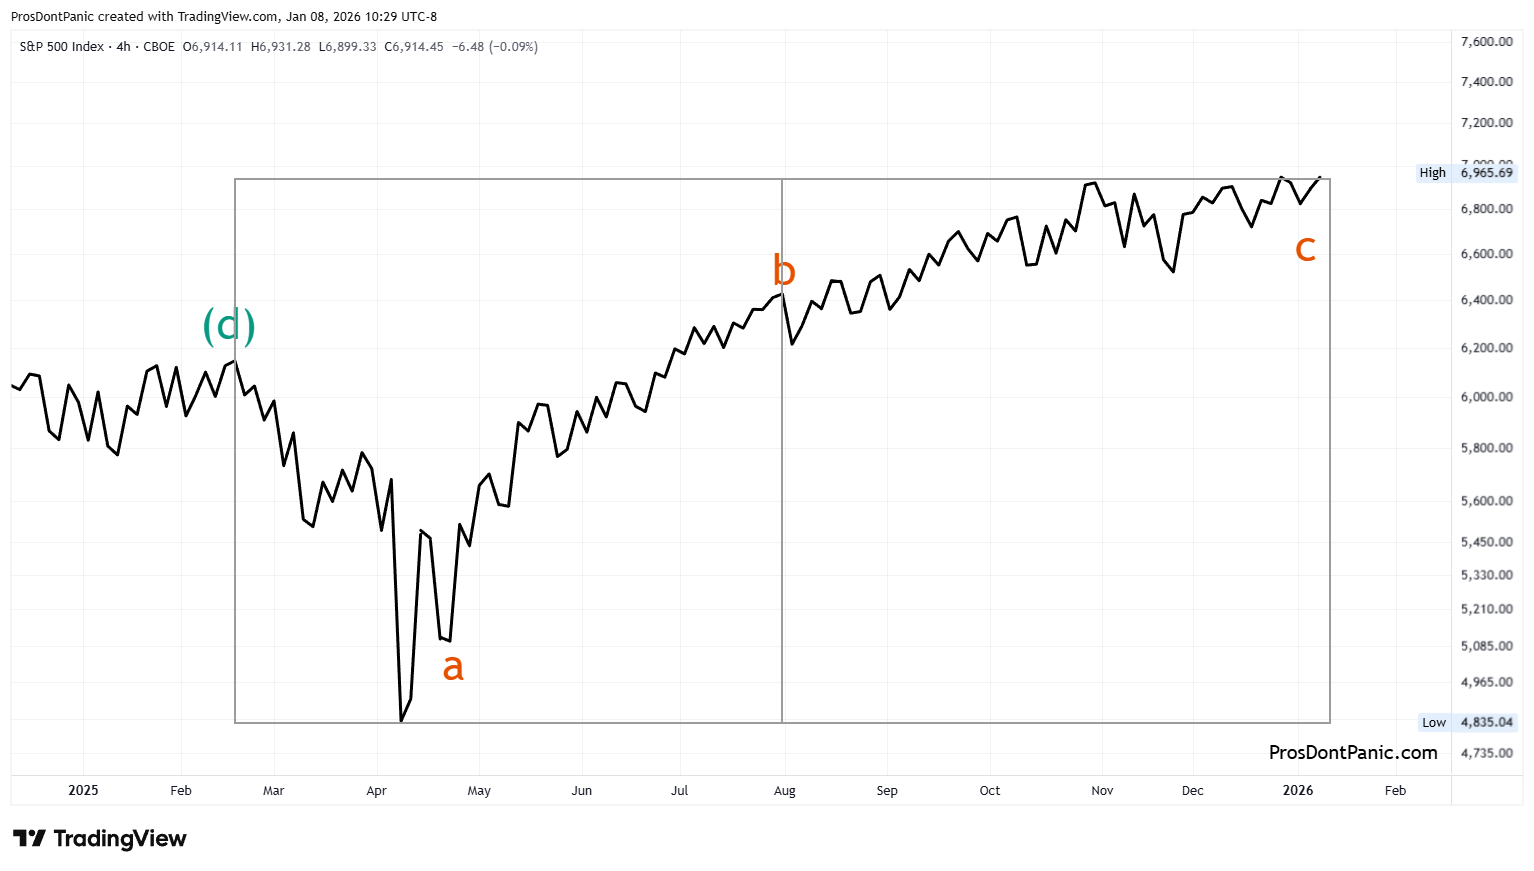
A closer look at the developing Wave-E:
Wave-b of (e) was a strong running correction lifting the market higher.
Wave-c of (e) is going against the trend so you should see bouts of downside action but there is no guarantee the market will make it down to where wave-c is marked.
Bottom Line
SPX is completing a 26-year running bear market correction. We need to get through the end of Wave-(4) which is completing wave-E then the real bull market will begin.
This content is provided for informational and educational purposes only and does not constitute trading, investment, or financial advice. PDP does not provide trade recommendations, entry or exit signals, or portfolio guidance.