

This Weekly Update reveals the NIFTY‘s latest market structure and pattern development using hand-drawn monowave charts and orthodox Neowave logic so you can make informed decisions about market direction.
2.5 Yearly Chart
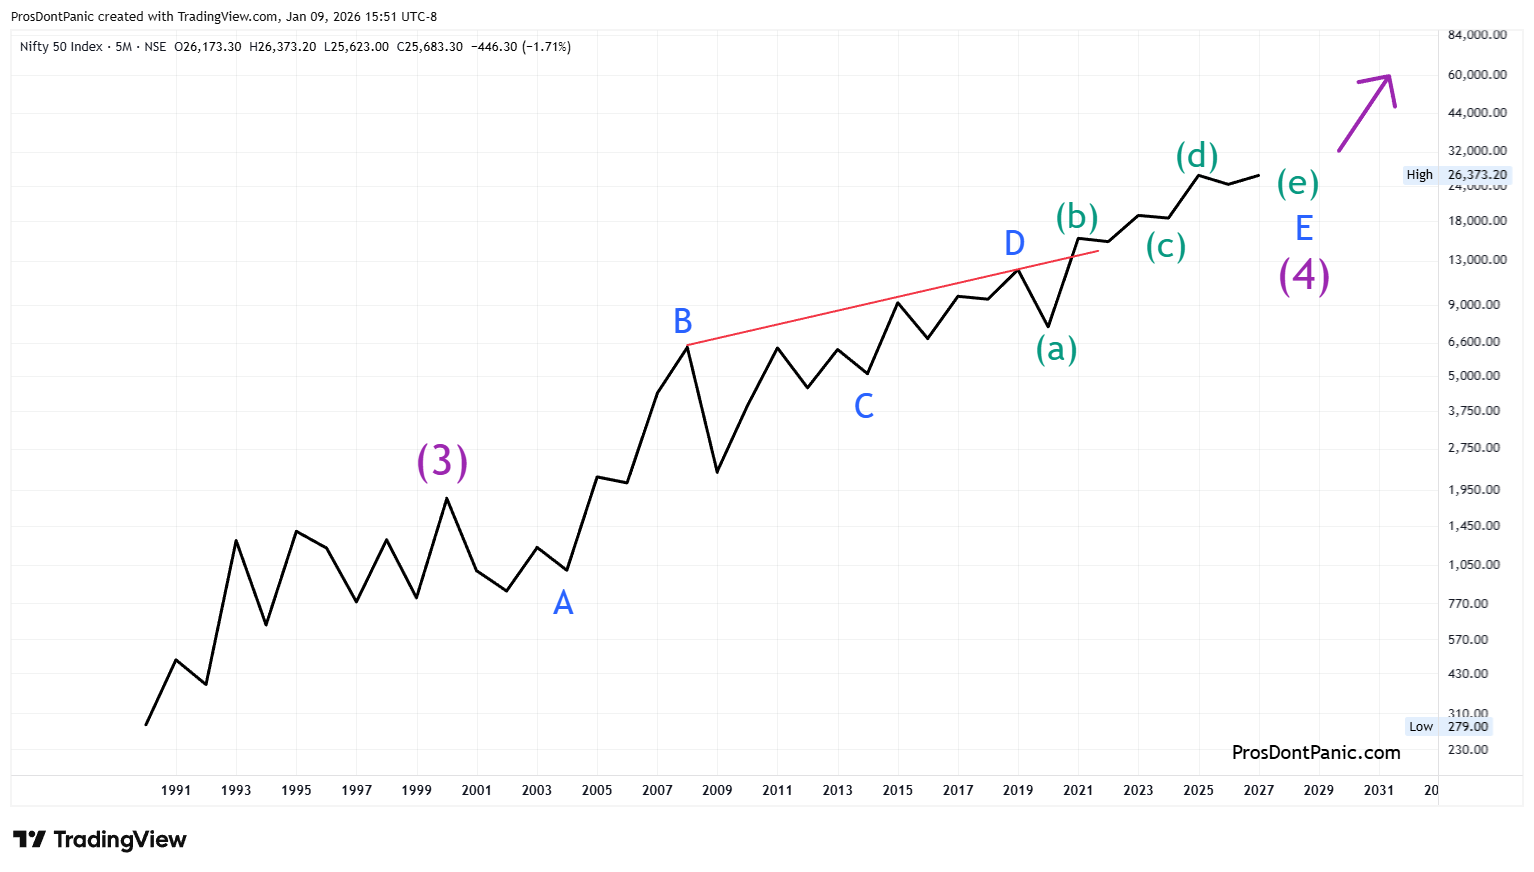
Impulsive wave topped in 2000 and commenced a 26-year bear market running correction (Wave-(4)) matching the S&P 500. When Wave-(4) is finished Wave-(5) should commence with all degrees going to the upside and a very powerful bull market move will follow.
Major trend force (purple)= UP
Minor trend force (blue) = DOWN
6-Monthly Chart
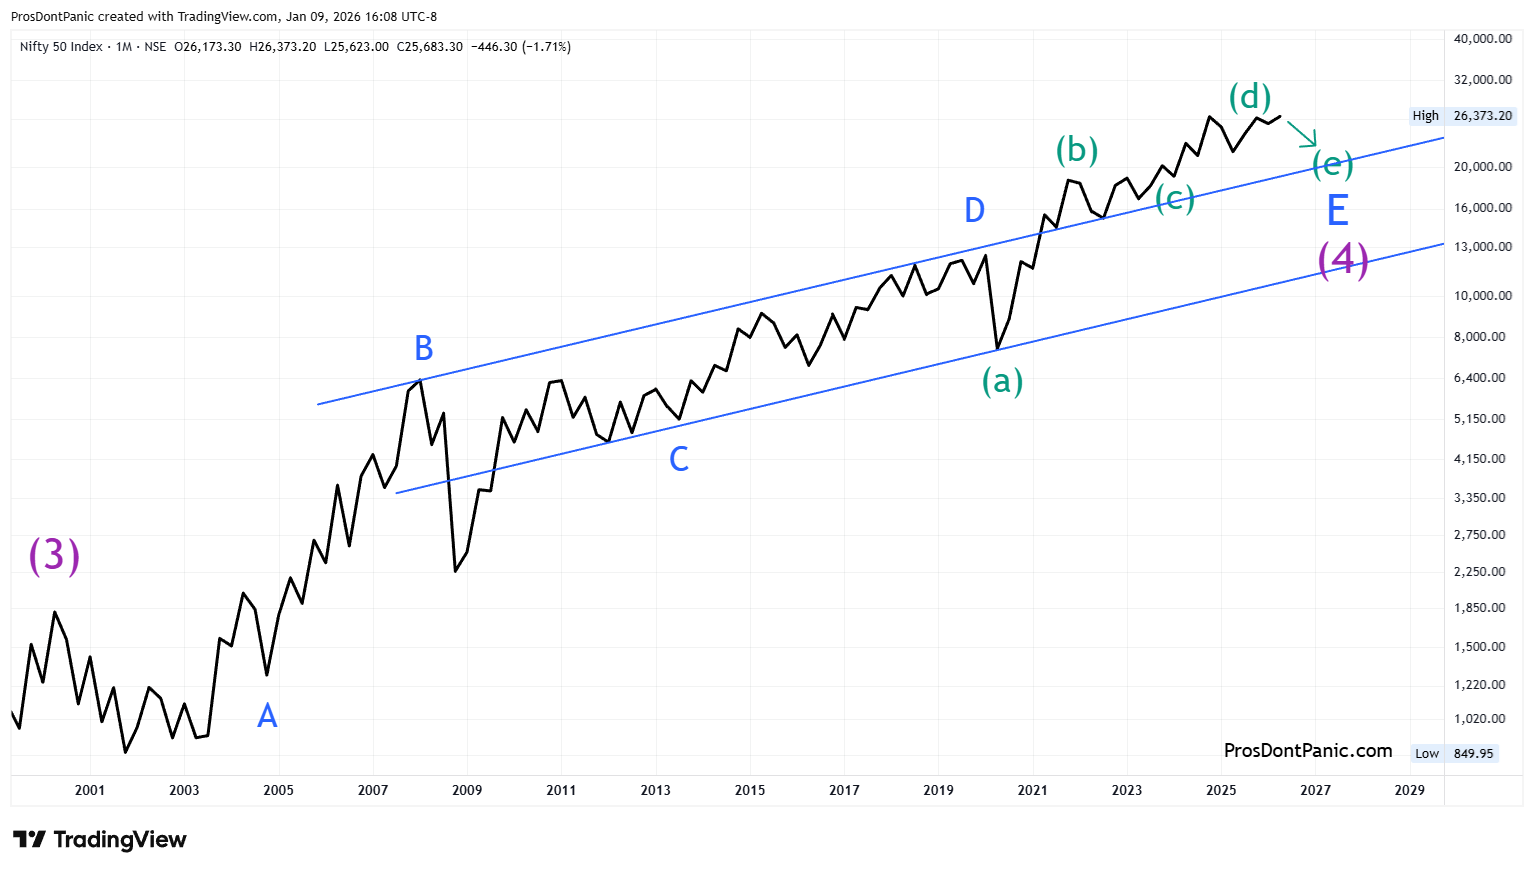
A closer look at Wave-(4) shows that wave-E is finishing up a Neutral Triangle the same as the S&P 500.
Monthly Chart
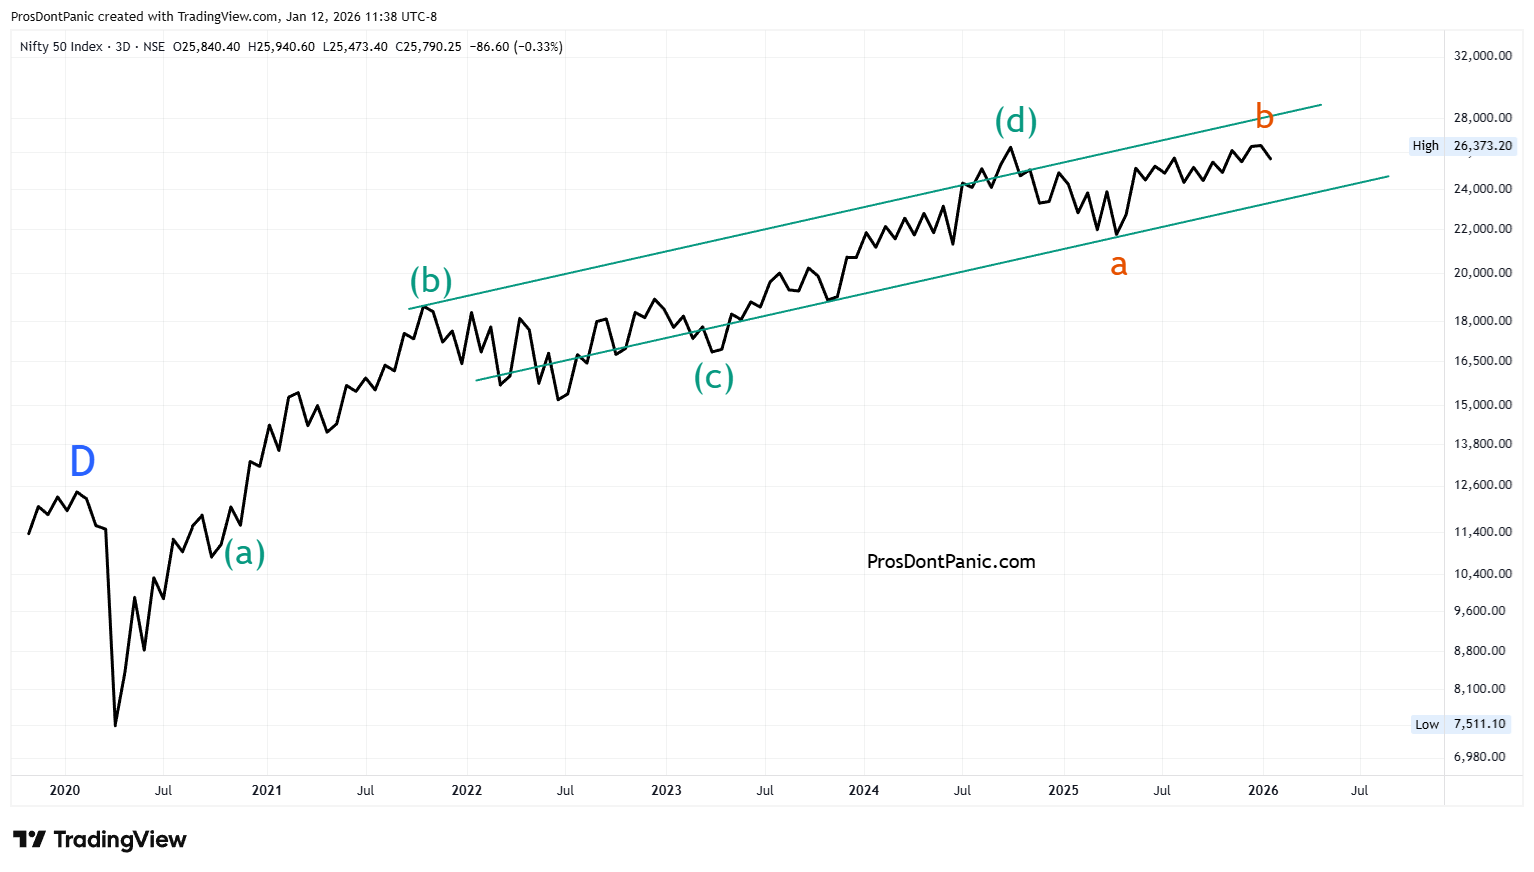
Zooming in on Wave-E of (4). A contracting triangle nearing completion.
As soon as wave-b of (e) has confirmed complete the market should see one or more downside bursts. This is to be expected and pros don’t panic.
Weekly Chart
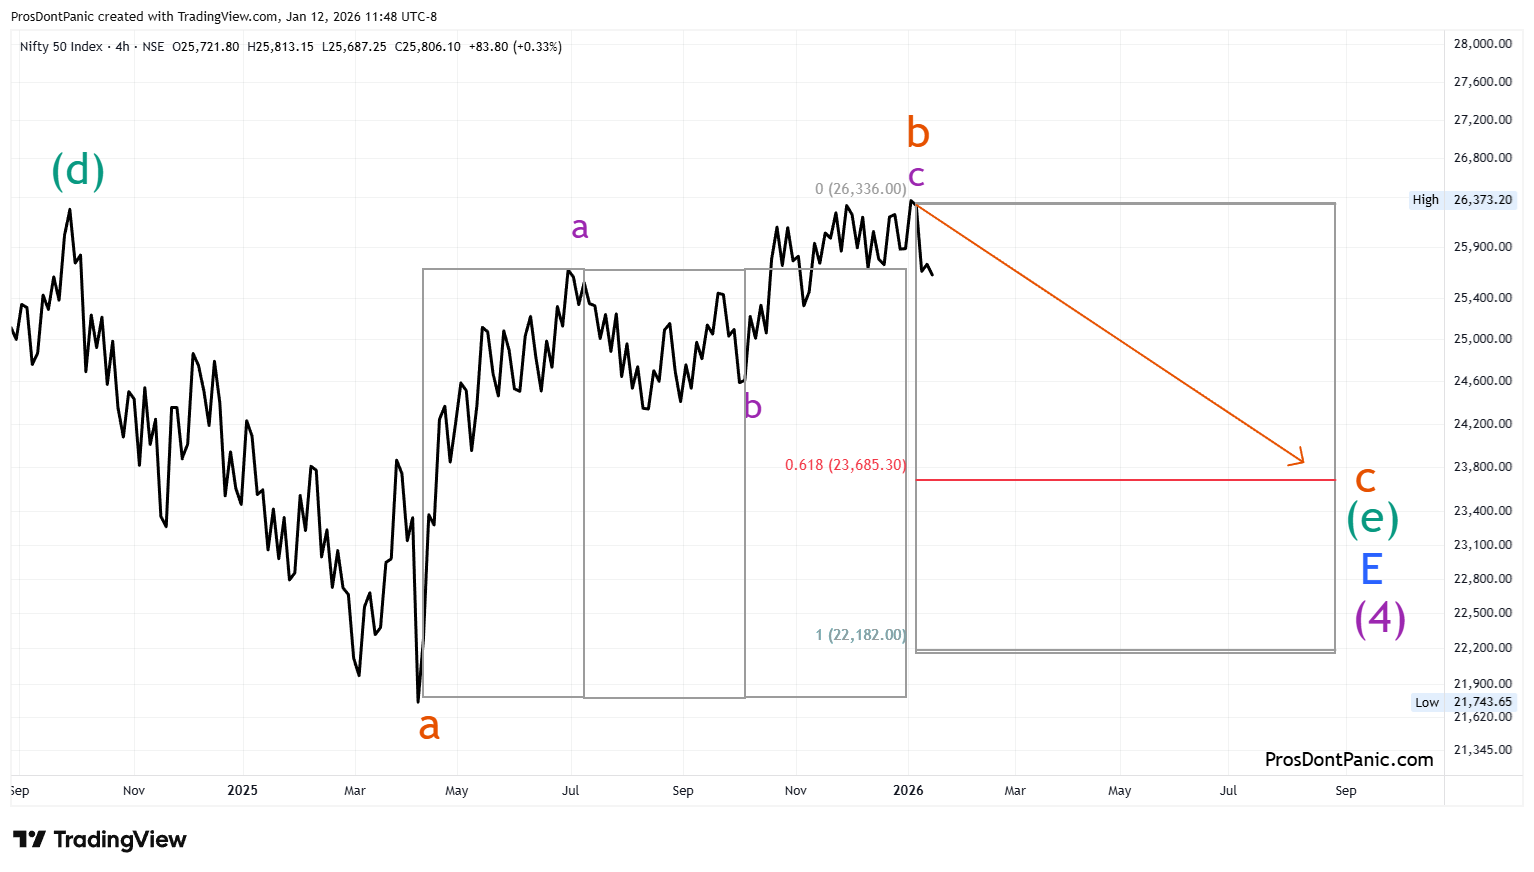
A closer look at the developing Wave-(e) of E:
Wave-c of (e) appears underway. There is no guarantee the price vector shown in the price/time box will be reached as this is a running correction.
The time expectation of late summer / fall 2026 holds for wave-c. We will be watching this closely in the Weekly Updates.
Bottom Line
As currently labelled, NIFTY is in the process of completing a 26-year running bear market correction. We need to get through the end of Wave-(4) which is completing wave-E then the real bull market in India will begin.
This content is provided for informational and educational purposes only and does not constitute trading, investment, or financial advice. PDP does not provide trade recommendations, entry or exit signals, or portfolio guidance.