

This Weekly Update reveals GOLD’s latest market structure and pattern development using custom monowave charts and orthodox NEoWave logic. I track patterns in the stock and crypto charts so you can make informed decisions about future market direction.
https://prosdontpanic.com
2.5 Yearly Chart

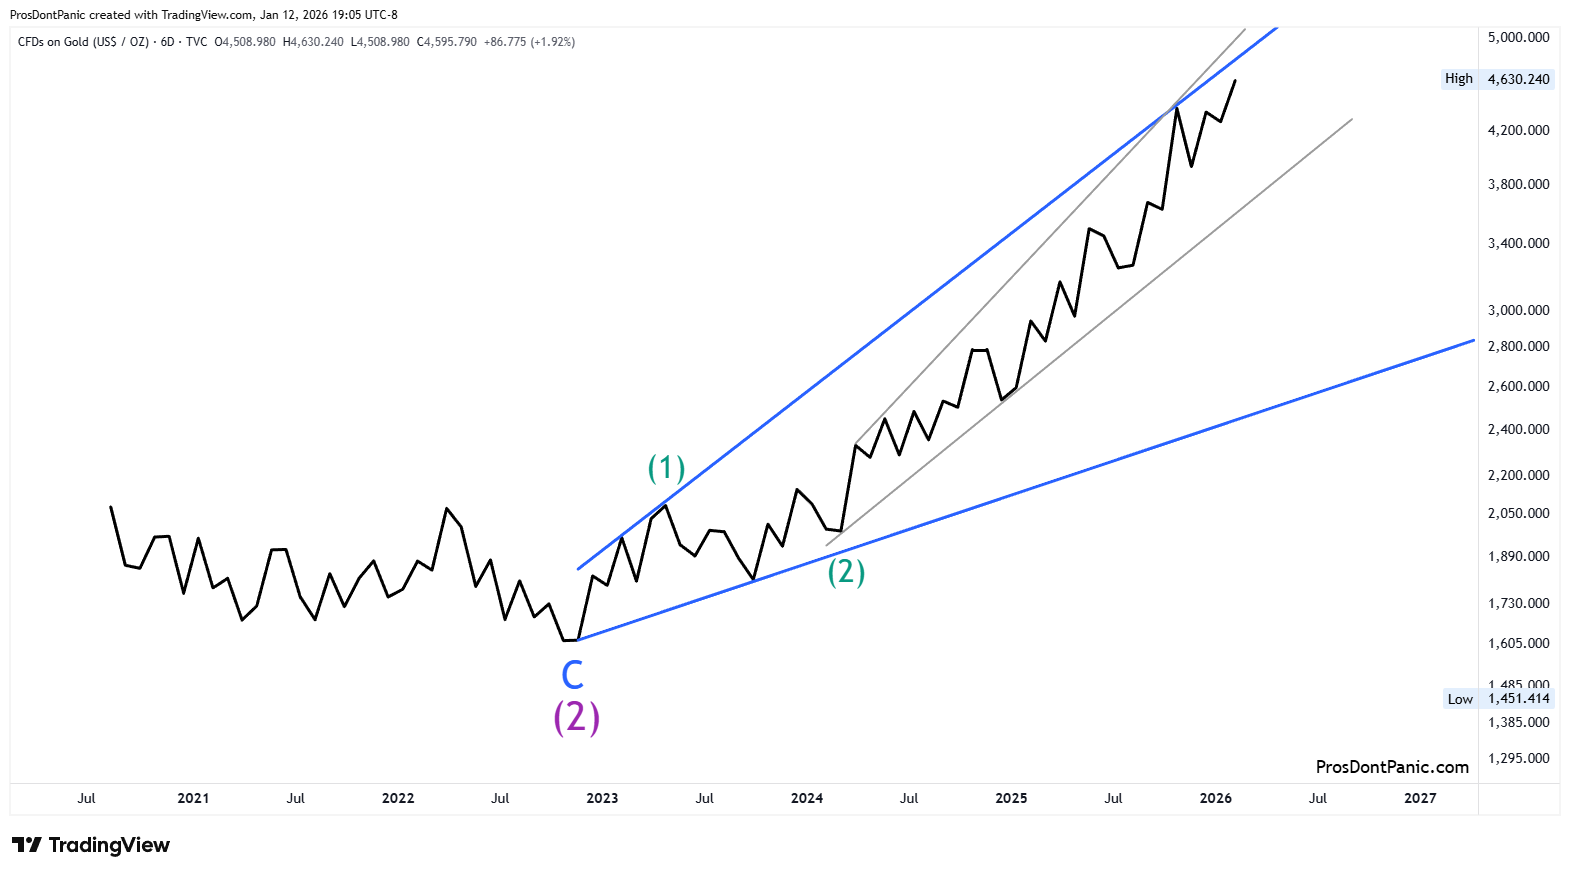
GOLD appears to be in the center of the river that has been in effect since it took off in 1972. The 3rd wave of an impulse has all degrees working together and GOLD should continue to rally. Notice the pop in the center of the “river”. This is where the “current” is strongest. Nothing goes up in a straight line but GOLD should eventually make it and to the other side of the channel and my estimates are marked with the price/time boxes.
Major Trend (Turquoise waves I, III, V)= UP
Minor Trend (Purple waves (1),(3),(5)) = UP
Minor Trend (Blue waves 1, 3, 5= UP
Monthly Chart
Not finding clear waves to label at this level as many resolve to “3’s” and not 5-wave patterns. This is due to “missing waves” that happen at certain degrees in monowave charts. So I will leave it to the larger charts to plot the course. None-the-less the market is advancing and not overlapping which is a clear sign of impulsive behavior even if it is hard to label.
Bottom Line
Gold is in the center of a multi-decade channel and advancing rapidly to the upside. All trends are UP and this is textbook “swimming with the current of the larger degree”. Expect further upside price action until GOLD gets to the other side of the channel on the 2.5 Yearly chart.
This content is provided for informational and educational purposes only and does not constitute trading, investment, or financial advice. PDP does not provide trade recommendations, entry or exit signals, or portfolio guidance.