

This update reviews Ethereum’s current market structure and pattern development using hand-built monowave charts and orthodox NEoWave logic.
2.5 Yearly Chart
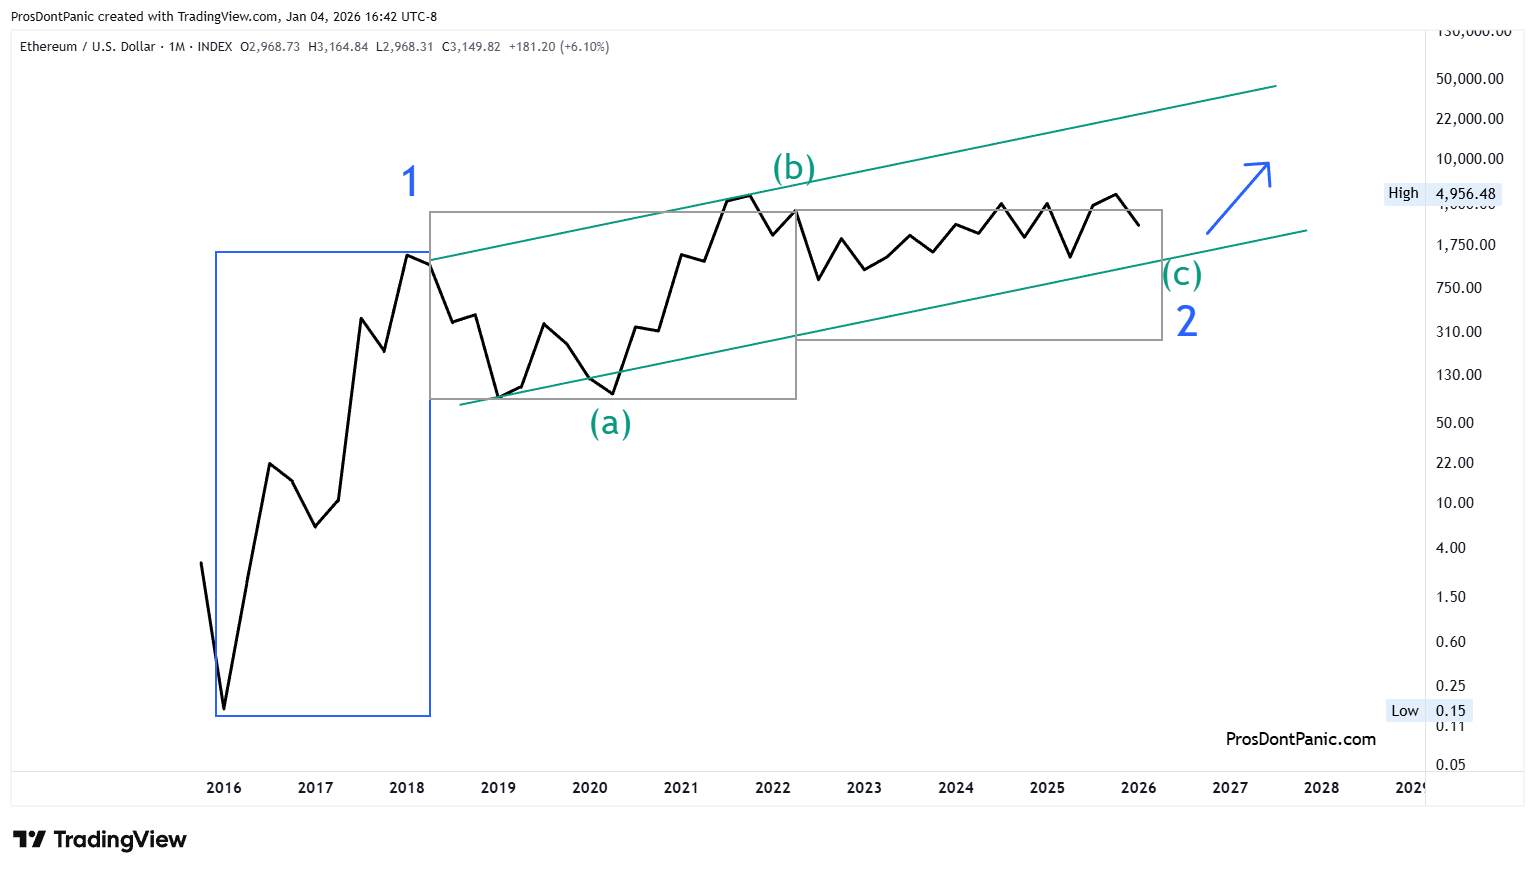
Ethereum completed am impulsive move in 2018 (same as Bitcoin) and has been correcting ever since. I break down Wave-2 below.
Blue (higher degree):
Wave-1 complete in 2018, Wave-2 in progress.
Trend= UP,
Green (lower degree):
Wave-(b) is confirmed complete, wave-(c) in progress with price/time box giving the potential vector.
Trend= DOWN
Monthly Chart
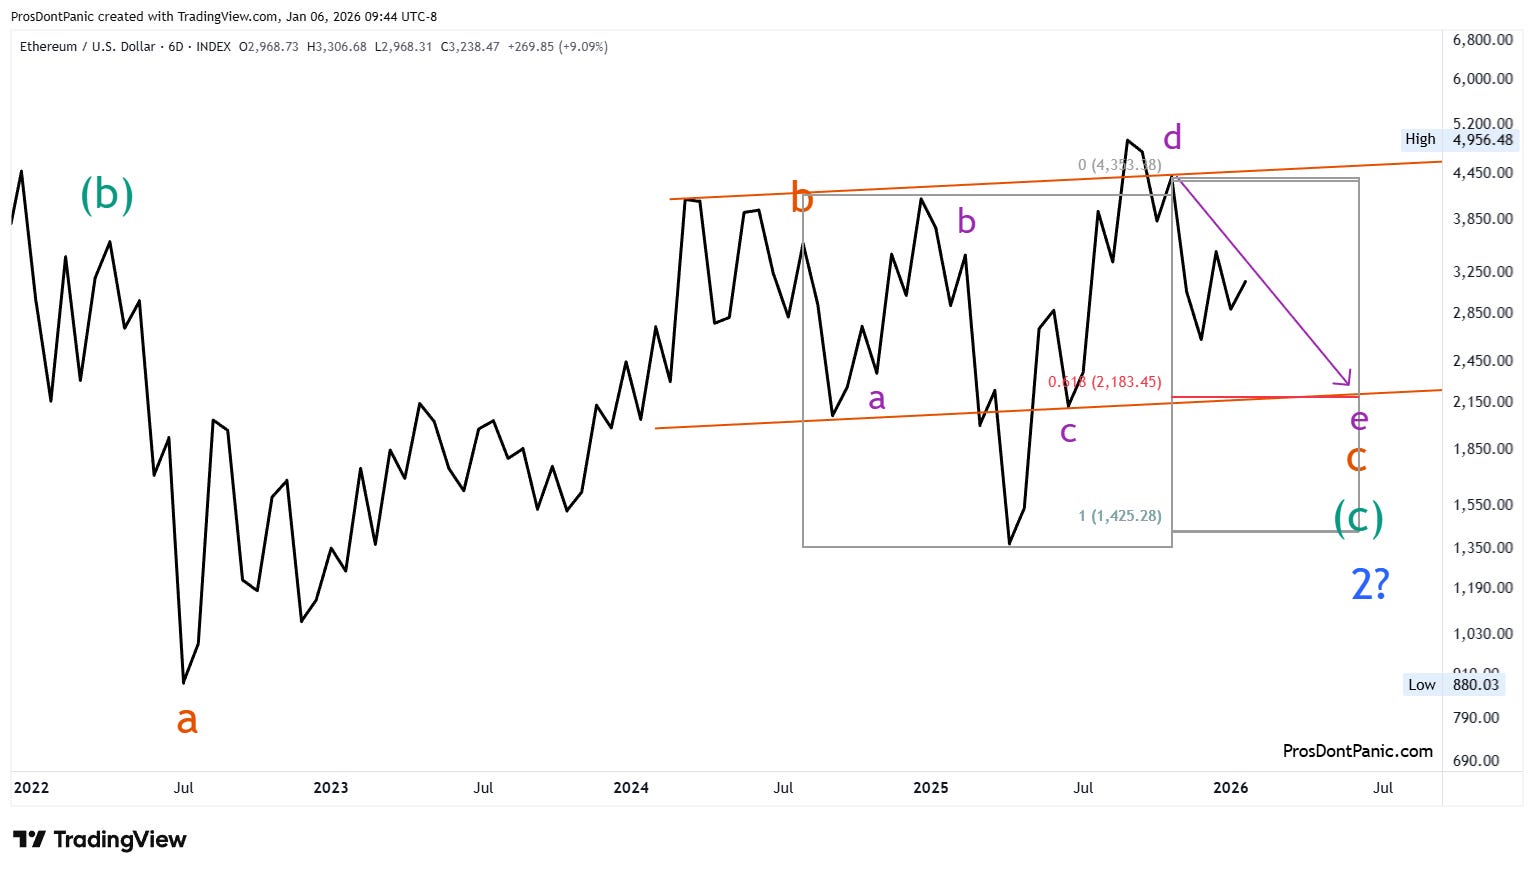
Tracking Wave-2:
Wave-(c) is tracing out a Neutral Triangle and is nearing completion.
Weekly Chart
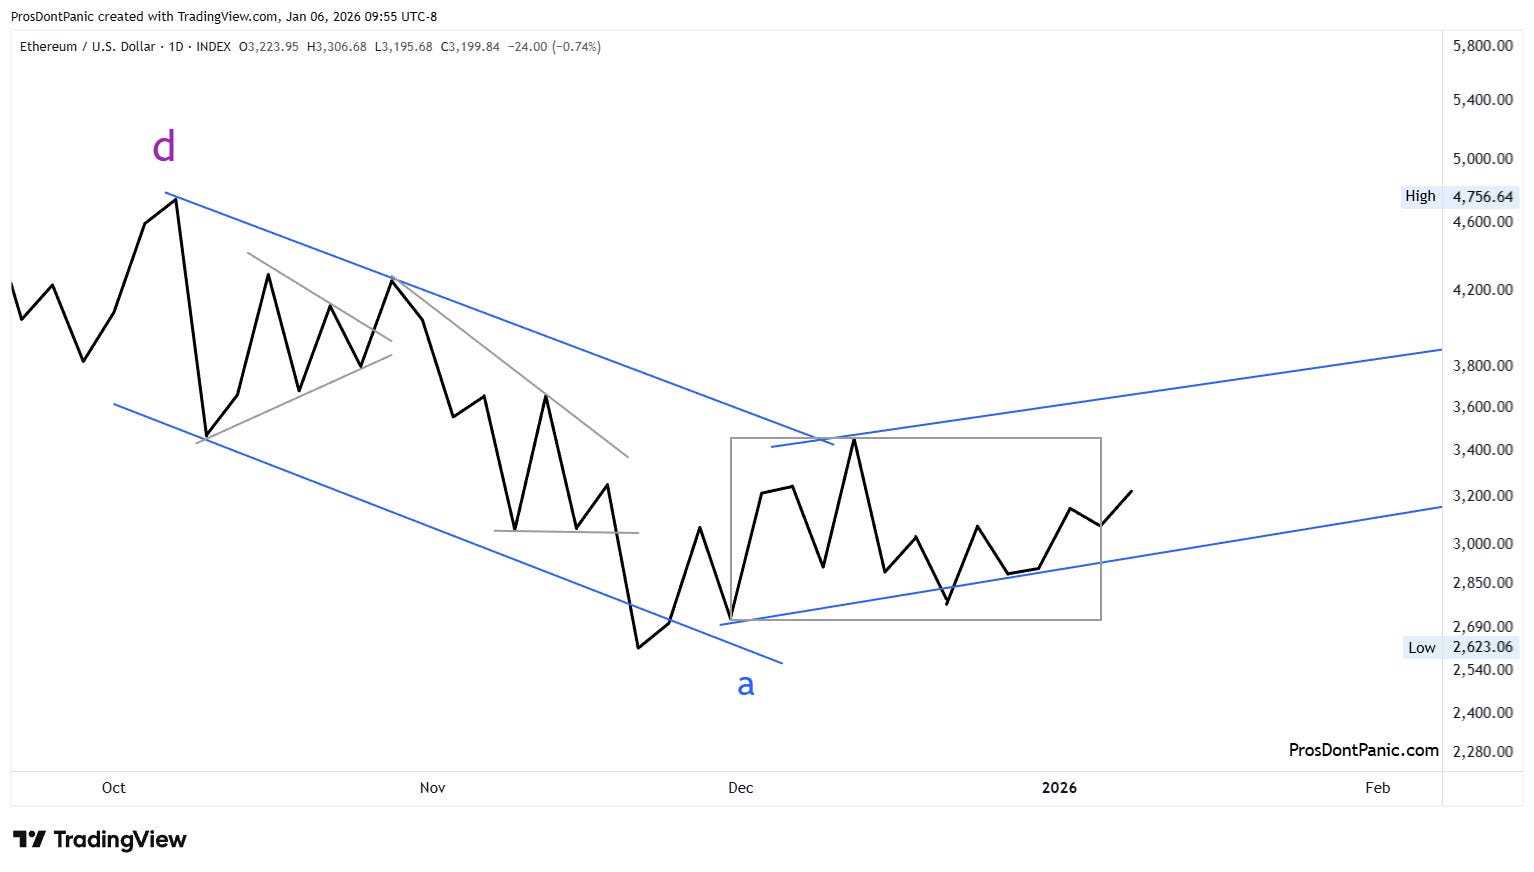
Tracking Wave-e:
Wave-(e) is just getting started and has more time per the Monthly Chart.
Bottom Line
Ethereum is in Wave-2 with Wave-e of (c) of 2 evolving.
This content is provided for informational and educational purposes only and does not constitute trading, investment, or financial advice. PDP does not provide trade recommendations, entry or exit signals, or portfolio guidance.