

This Weekly Update reveals USO’s latest market structure and pattern development using custom monowave charts and orthodox NEoWave logic. I track patterns in the stock and crypto charts so you can make informed decisions about future market direction.
https://prosdontpanic.com
6-Monthly Chart
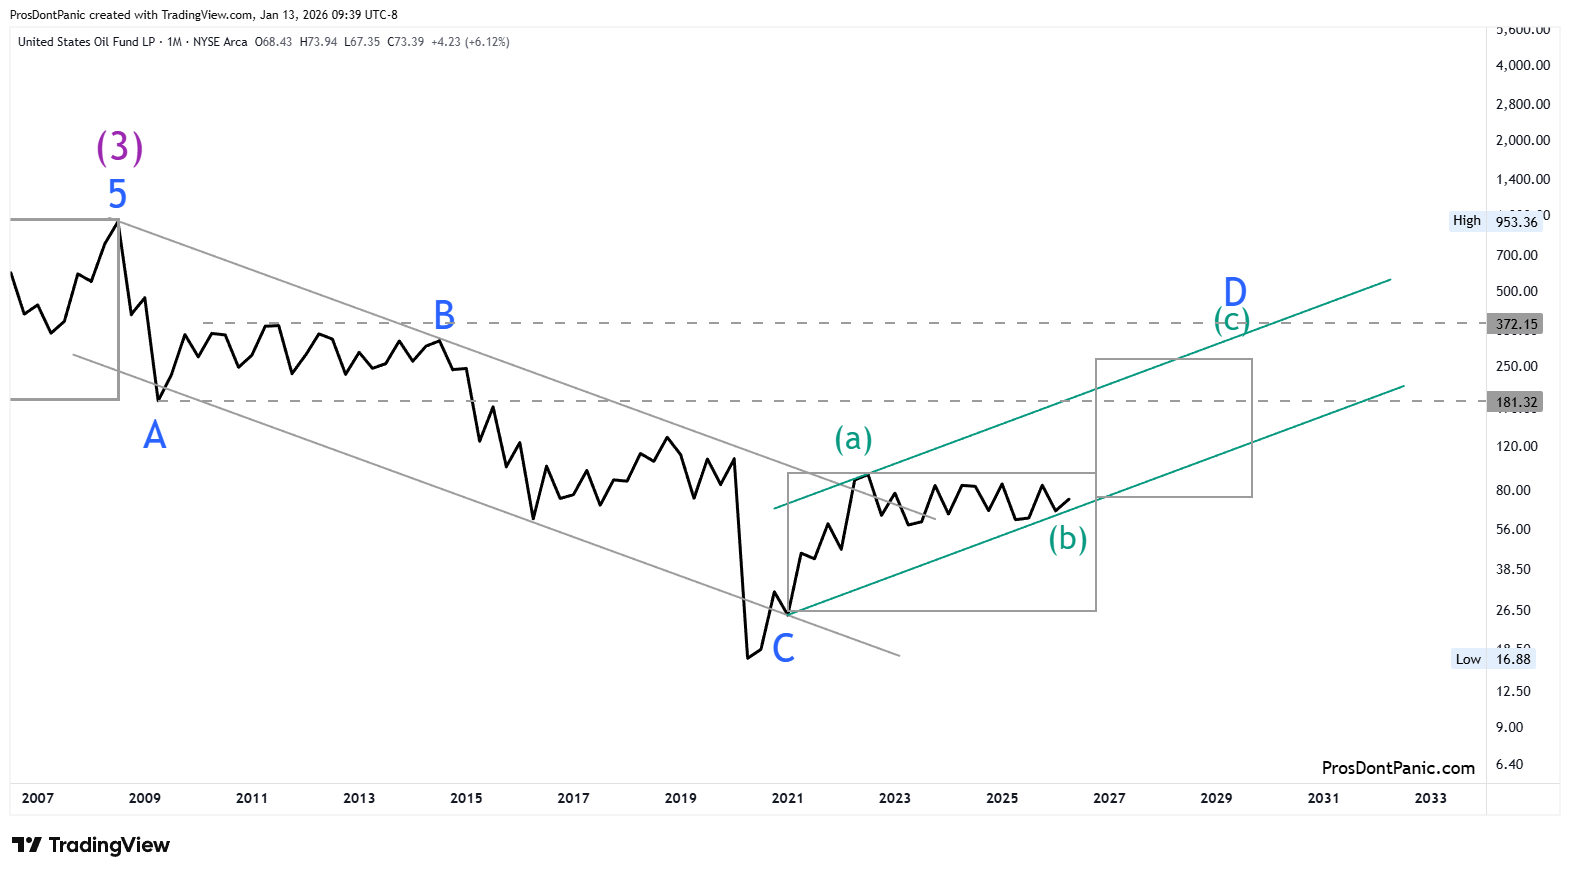
Crude oil data goes back to 1946 but TradingView doesn’t provide that historical data. I have used data from other sources (not seen in this chart) to build my analysis.
Wave-(3) ended an impulse pattern that lasted from 1973-2008. Our chart begins with the Wave-(4) correction starting in 2008. The start of wave-D is too weak to be considered a new Impulse and that is why it is marked as wave-D.
Wave-(4) appears to be developing as a classic Neutral Triangle (head and shoulders) pattern.
Wave D of (4) is now developing.
Wave-D could easily rise to the area of Wave-B. Waves B and D must overlap if they are a triangle so this scenario is quite possible and marked on the chart.
Minor Trend (Purple waves (1),(3),(5)) = UP
Minor Trend (Blue waves A, C, E= DOWN
Monthly Chart

A closer look at the developing Wave-D.
When compared to wave-C, wave-D is weak, sideways and overlapping and so it is not marked as the start of a new trend up.
Letting wave-(b) work itself out. Any strong move to the upside may signal the end of (b) and the start of (c). Will be tracking in the Weekly Update.
Weekly Chart
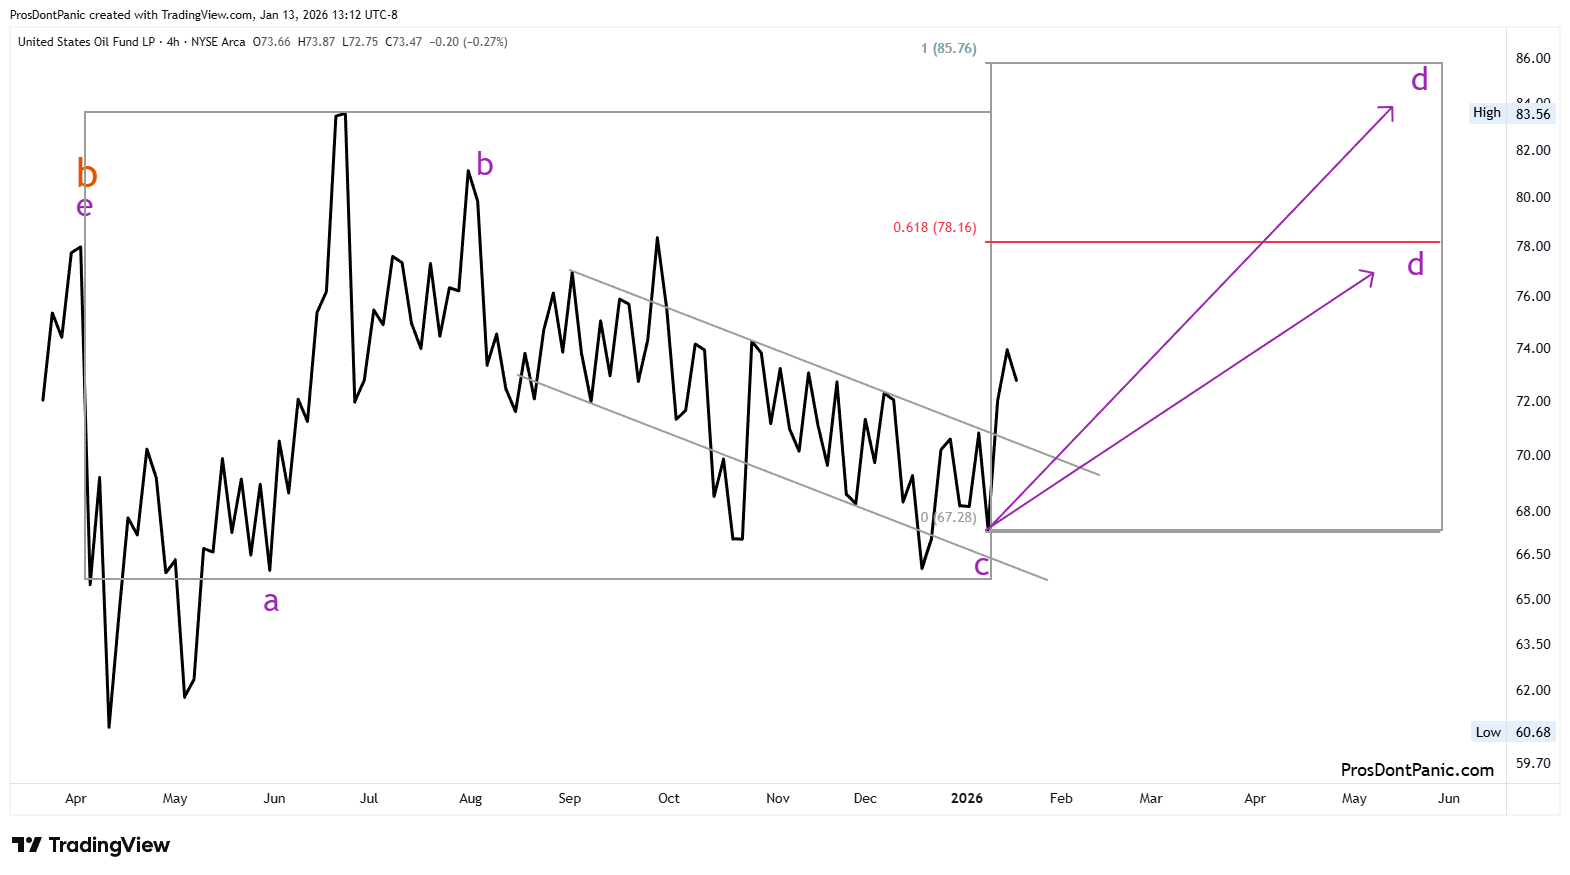
Focusing in on orange wave-c of (b).
Purple wave-c appears complete and confirmations have been met. The larger charts showed a different count but that is allowed when the outcome is the same. Both counts are expecting an upside run. In this case its purple wave-d.
Bottom Line
USO is still climbing out of the lows of the Pandemic and following a 5-wave triangle pattern where wave-C is the longest of the trend waves (A, C and E). Expecting much higher crude oil prices in the future.
This content is provided for informational and educational purposes only and does not constitute trading, investment, or financial advice. PDP does not provide trade recommendations, entry or exit signals, or portfolio guidance.