

This update reviews Bitcoin’s current market structure and pattern development using hand-built monowave charts and orthodox NEoWave logic.
6-Monthly Chart
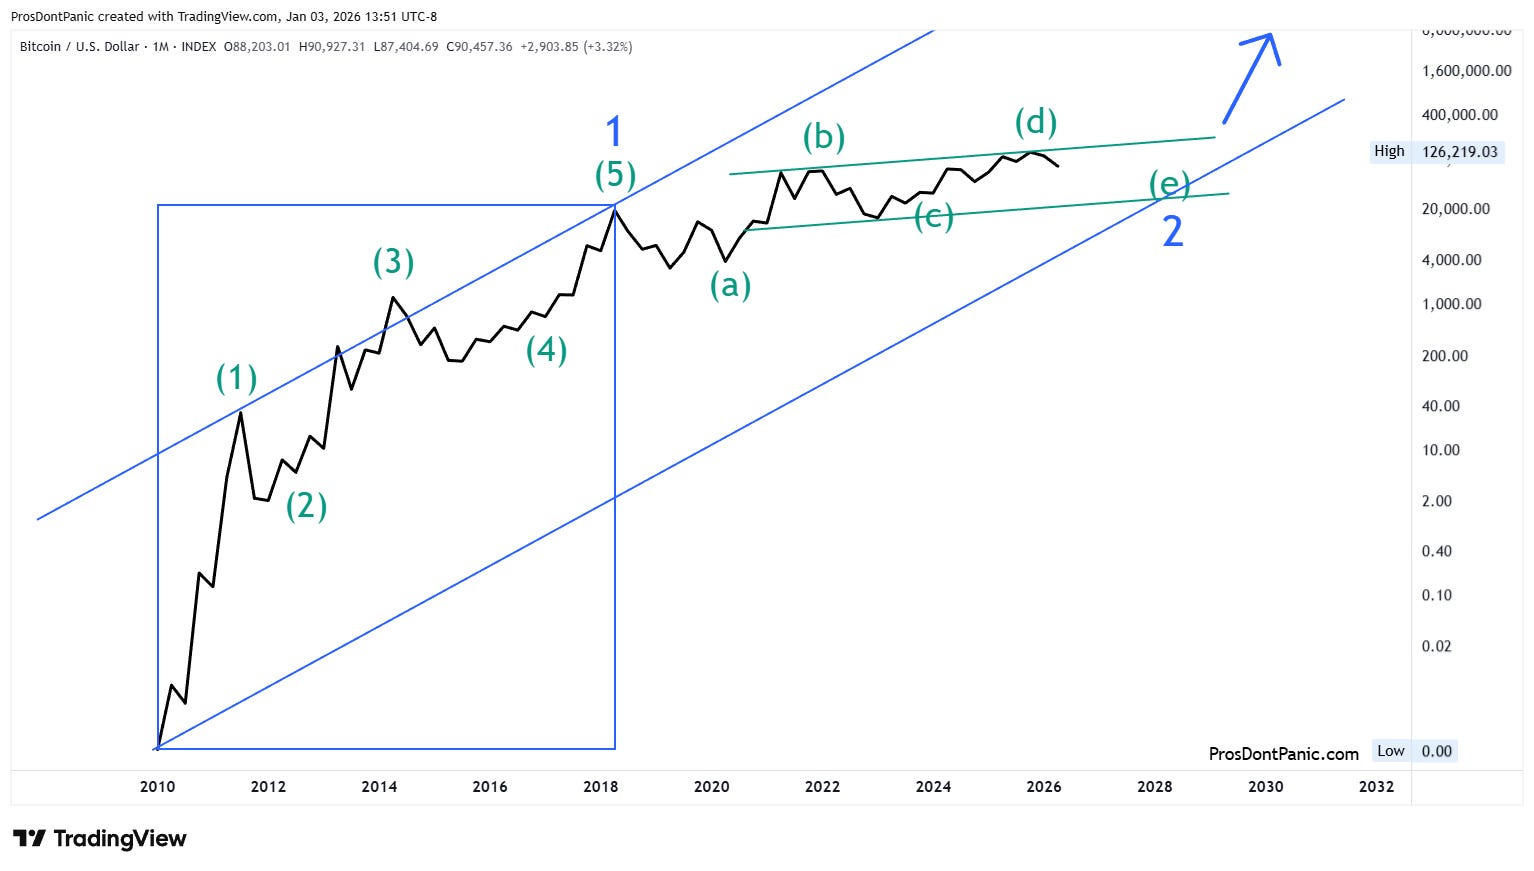
Bitcoin has been correcting a 5-wave Impulse pattern since 2018. Wave -2 is a running correction which implies a strong bull move when it completes. I track Wave-2 in the following charts below.
Blue (higher degree):
Wave-1 complete in 2018, Wave-2 in progress.
Trend= UP
Green (lower degree):
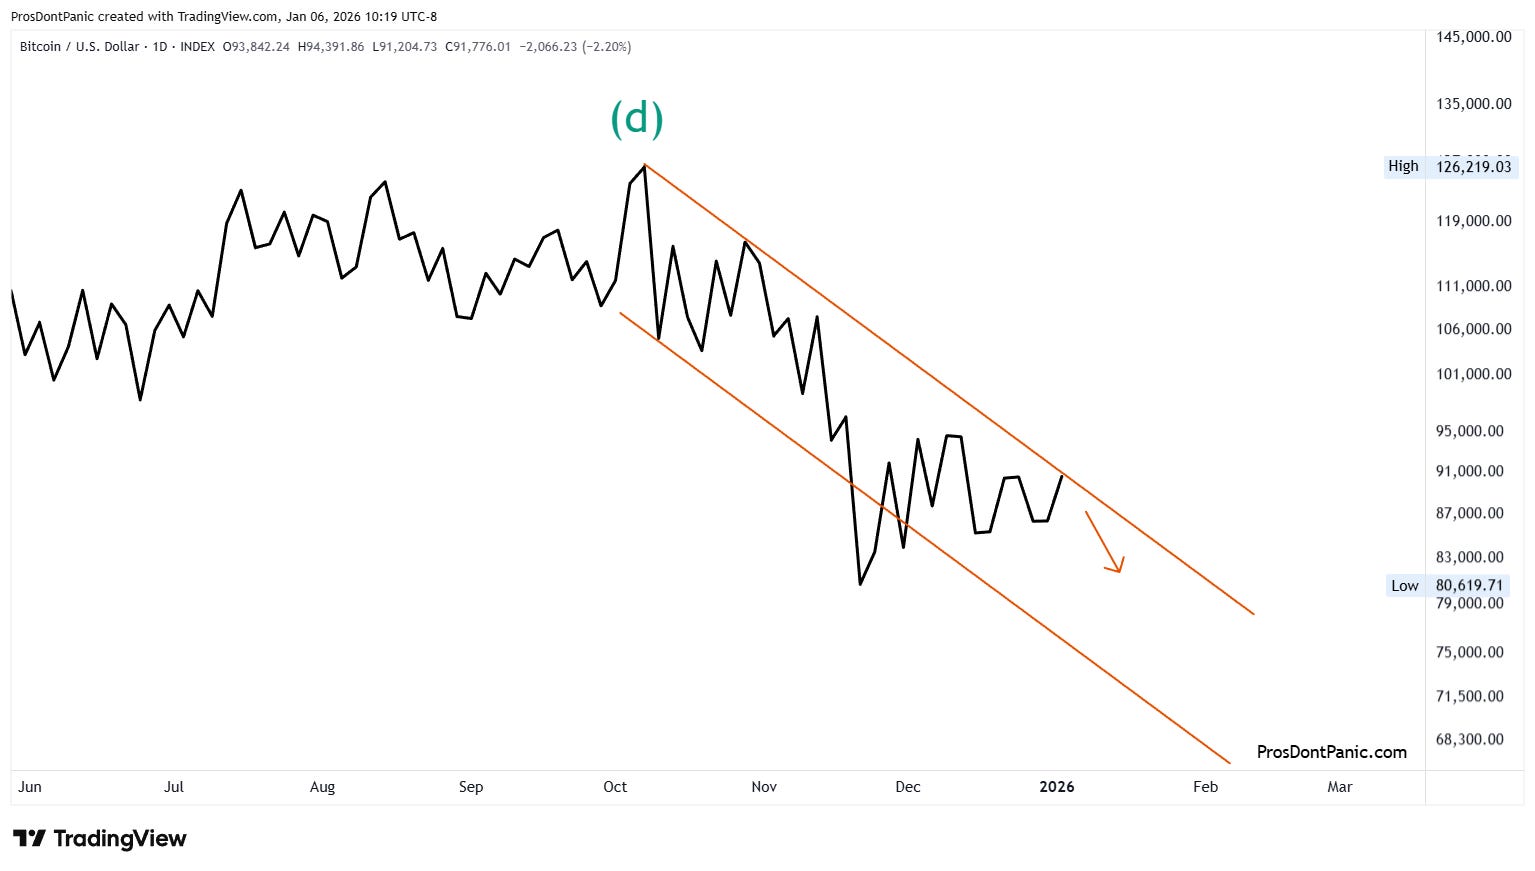
Wave-(d) appears complete (see lower charts), starting Wave-(e)
Trend= DOWN
Monthly Chart

Tracking Wave-2:
Wave-(d) has confirmed complete and it I am tracking wave-(e) as started.
Price/time box gives an expectation for wave-(e).
Weekly Chart
Tracking Wave-(e):
Wave-(e) is just getting started and the time box in the Monthly chart shows the potential.
As stated above the green trend is DOWN and we should be expecting sharp down moves during wave-(e)’s development. Pros don’t panic.
Bottom Line
Bitcoin remains within the correcting forces of the large Wave-2, with Wave-(e) of 2 unfolding. There is a lot more time to burn for wave-(e). Be patient.
This content is provided for informational and educational purposes only and does not constitute trading, investment, or financial advice. PDP does not provide trade recommendations, entry or exit signals, or portfolio guidance.