

This update reviews BNB’s current market structure and pattern development using hand-built monowave charts and orthodox NEoWave logic.
6-Monthly Chart

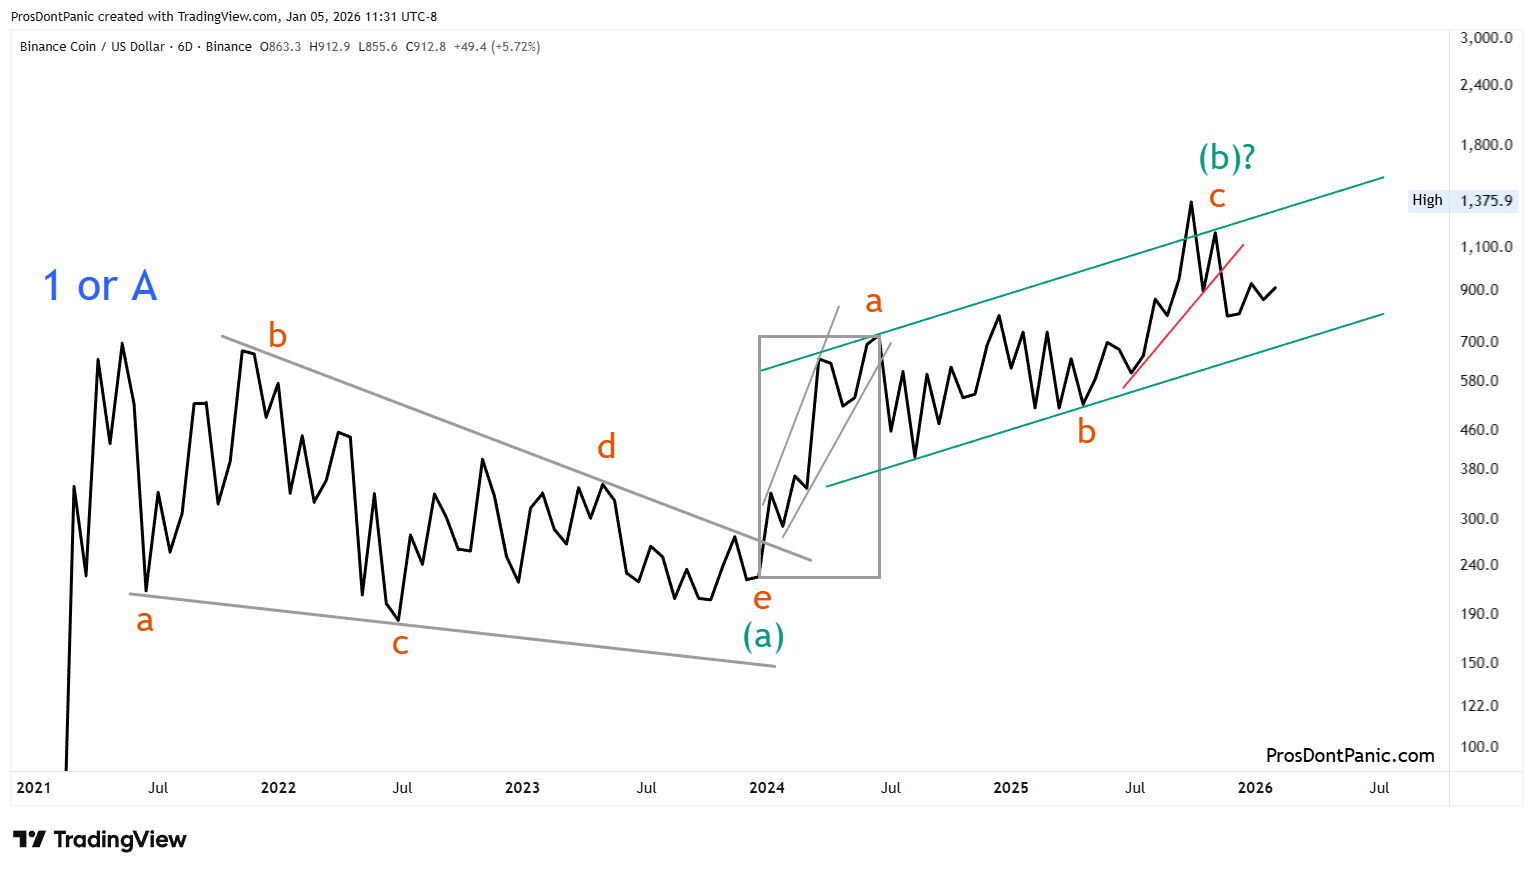
Blue (higher degree):
Wave-1 (or A) is marked as complete in 2022. Don’t get hung up on wave labels, focus on the changes in structure. The response to the impulsive rise that ended in 2022 is definitely corrective and is being tracked as Wave 2 (or B).
Blue trend= UP
Green (lower degree):
Wave-(b) is nearing completion but not yet marked complete. has been tracing out an ABC pattern in opposition to the larger trend.
The complexity of waves (a) and (b) requires wave-(c) to subdivided and most likely will become a 5-wave triangle. When wave-(b) is confirmed complete we will see how wave-(c) responds.
Green trend= DOWN
Monthly Chart
A closer look at the developing Wave-2 or B:
It appears that wave-(b) has confirmed complete but I am cautious that wave-(b) is still subdividing. A strong break through the lower green trendline would be help this case.
Weekly Chart

Tracking the development of wave-(b):
The choppy weakness off the high in Oct-Nov leads me to believe that orange wave-c is subdividing into a 5-wave triangle as shown on the chart.
Bottom Line
BNB is in a large correction and the lower charts show that wave-(b) is likely not yet complete. When wave-(b) is complete a sharp move down for wave-(c) is to be expected.
This content is provided for informational and educational purposes only and does not constitute trading, investment, or financial advice. PDP does not provide trade recommendations, entry or exit signals, or portfolio guidance.