

This Weekly Update reveals the US10YR’s latest market structure and pattern development using custom monowave charts and orthodox NEoWave logic. I track patterns in the stock and crypto charts so you can make informed decisions about future market direction.
https://prosdontpanic.com
2.5 Yearly Chart
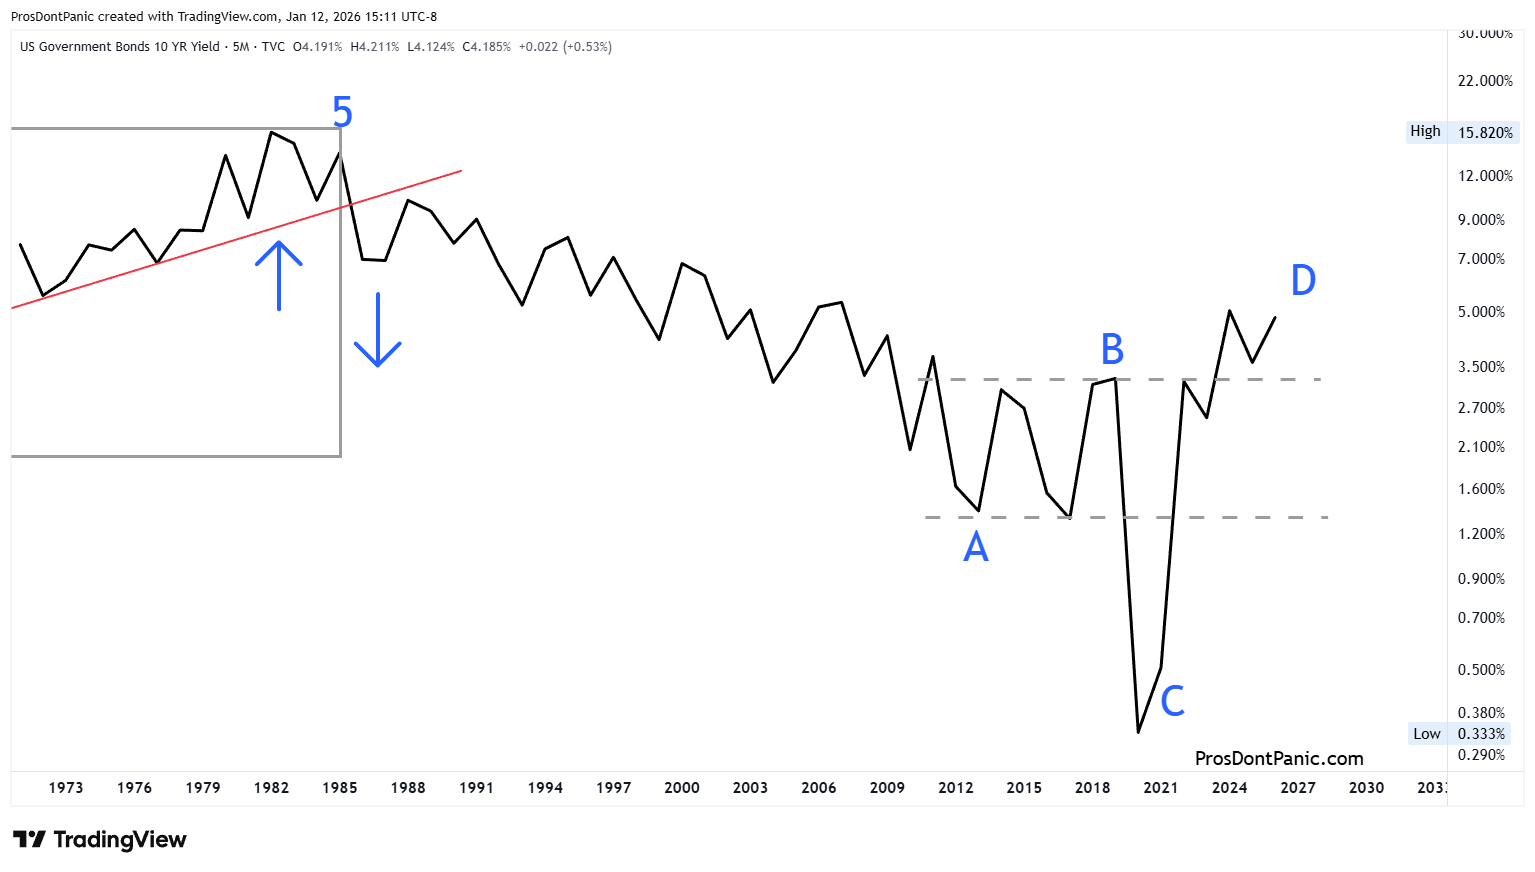
In 1985, the major trend changed to DOWN and it is still down. This means the largest, fastest moves should be with the downward blue trend waves A, C and E.
Major Trend (blue waves A, C, E)= DOWN
Minor Trend (green waves (a), (c), (e))= UP
The market appears to be forming a Neutral Triangle where wave-C is the longest wave.
In a Neutral Triangle it is common for the market to return to the area between the dashed lines. We can be on the lookout for this for wave-E although it is not required but I am expecting lower rates in the future after wave-D has completed.
6-Monthly Chart
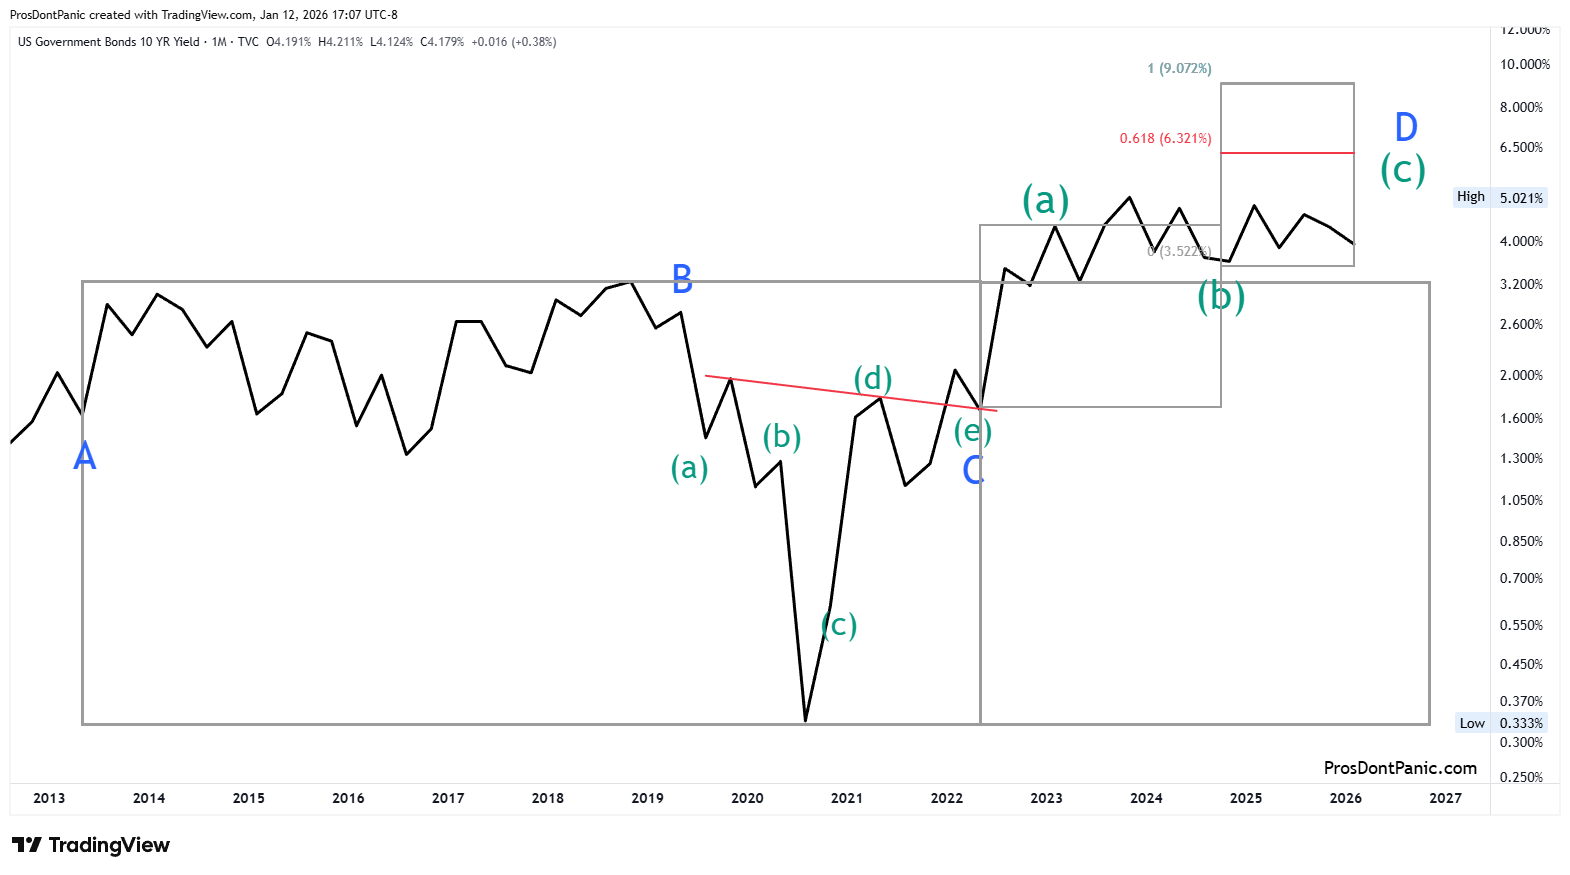
Tracking Wave-D:
2 scenarios exist and we must be ready for either.
Scenario 1: as marked on the chart
Scenario 2: wave-D started at the major low and completed at the high where I have wave-a marked and we are currently tracking wave-E.
A sharp move above or below the consolidation (2023-2026) will reveal which scenario is accurate. I am sticking with the chart until proven otherwise.
The price/time box is says that wave-D is nearing completion. My expectation is that wave-E will bring this market back to 3% or lower. As stated above in the 2.5 Yearly comments wave-E could easily come back to the 1-2% range but is not required to.
Monthly Chart
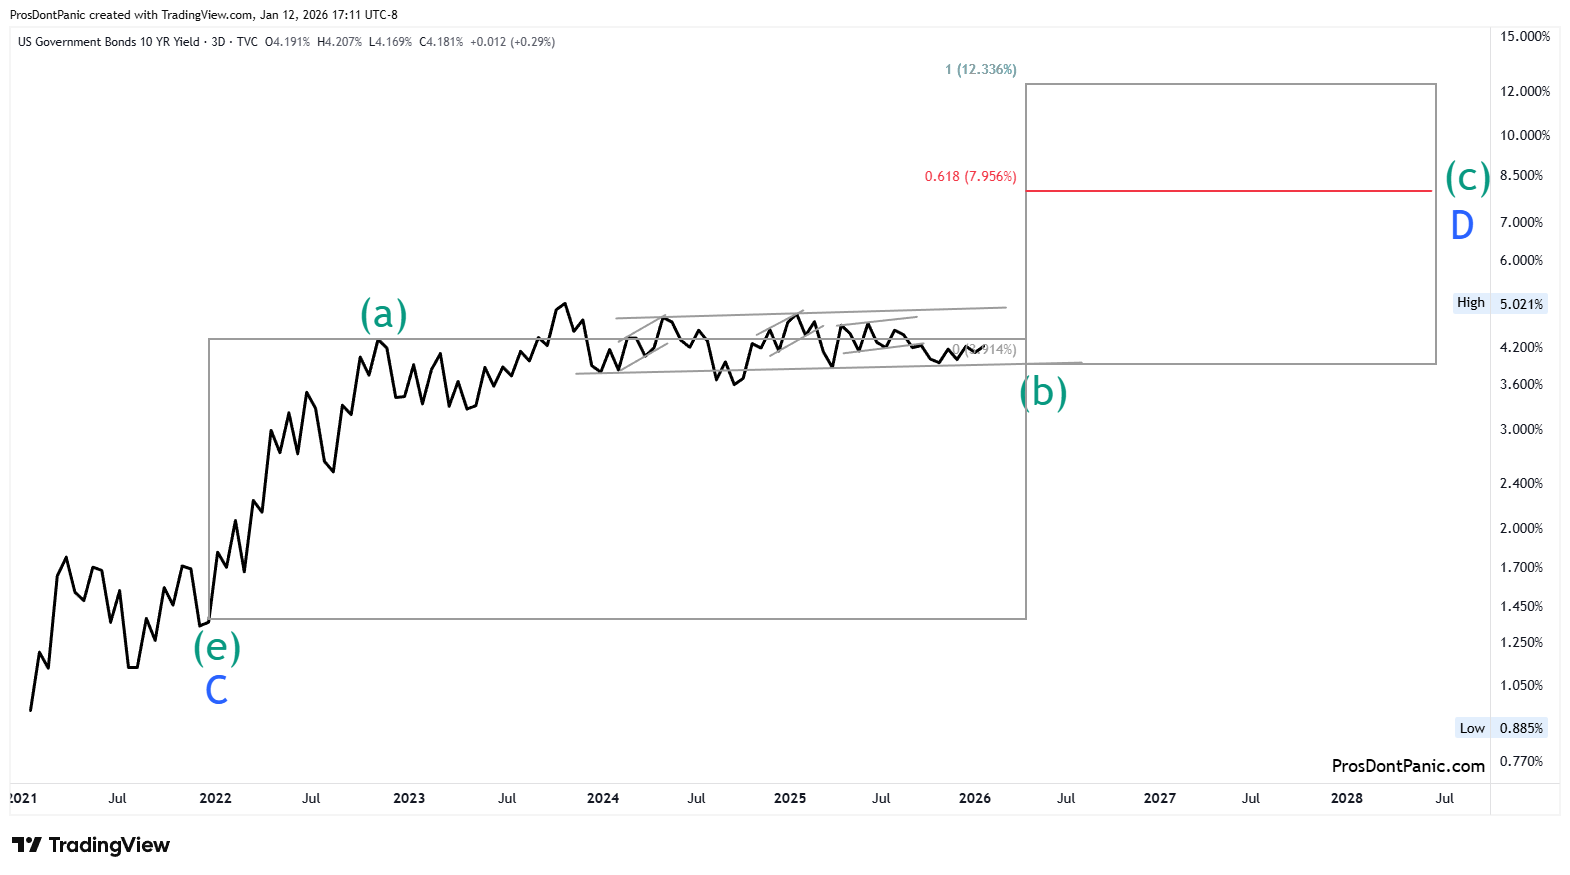
Wave-D closer look. The expectation is that we need to close out this ABC pattern with another push up.
Bottom Line
The 10YR appears to be in Wave-D of a correction that started in 1985. Wave-D should be slower and more subdivided than Wave-C and it is so I am still expecting a sharp move down for Wave-E in the future (after we have confirmed that wave-D is complete).
This content is provided for informational and educational purposes only and does not constitute trading, investment, or financial advice. PDP does not provide trade recommendations, entry or exit signals, or portfolio guidance.